

In 2024, how many US deaths did CDC record under the code for falls on level ground that covers trips and stumbles: about 80, about 800 or about 8,000?
About 800. CDC records 830 such deaths in 2024, roughly 1 in 410,000 US residents (CDC WONDER).
That count covers deaths the certificate put down to a fall on the same level from slipping, tripping or stumbling, which is ICD-10 code W01, listed as the underlying cause for a US resident in 2024; this page calls it the trip code. The odds divide those deaths by the US population in the same CDC table. Nothing on this page is adjusted for age.
Why the number is so small
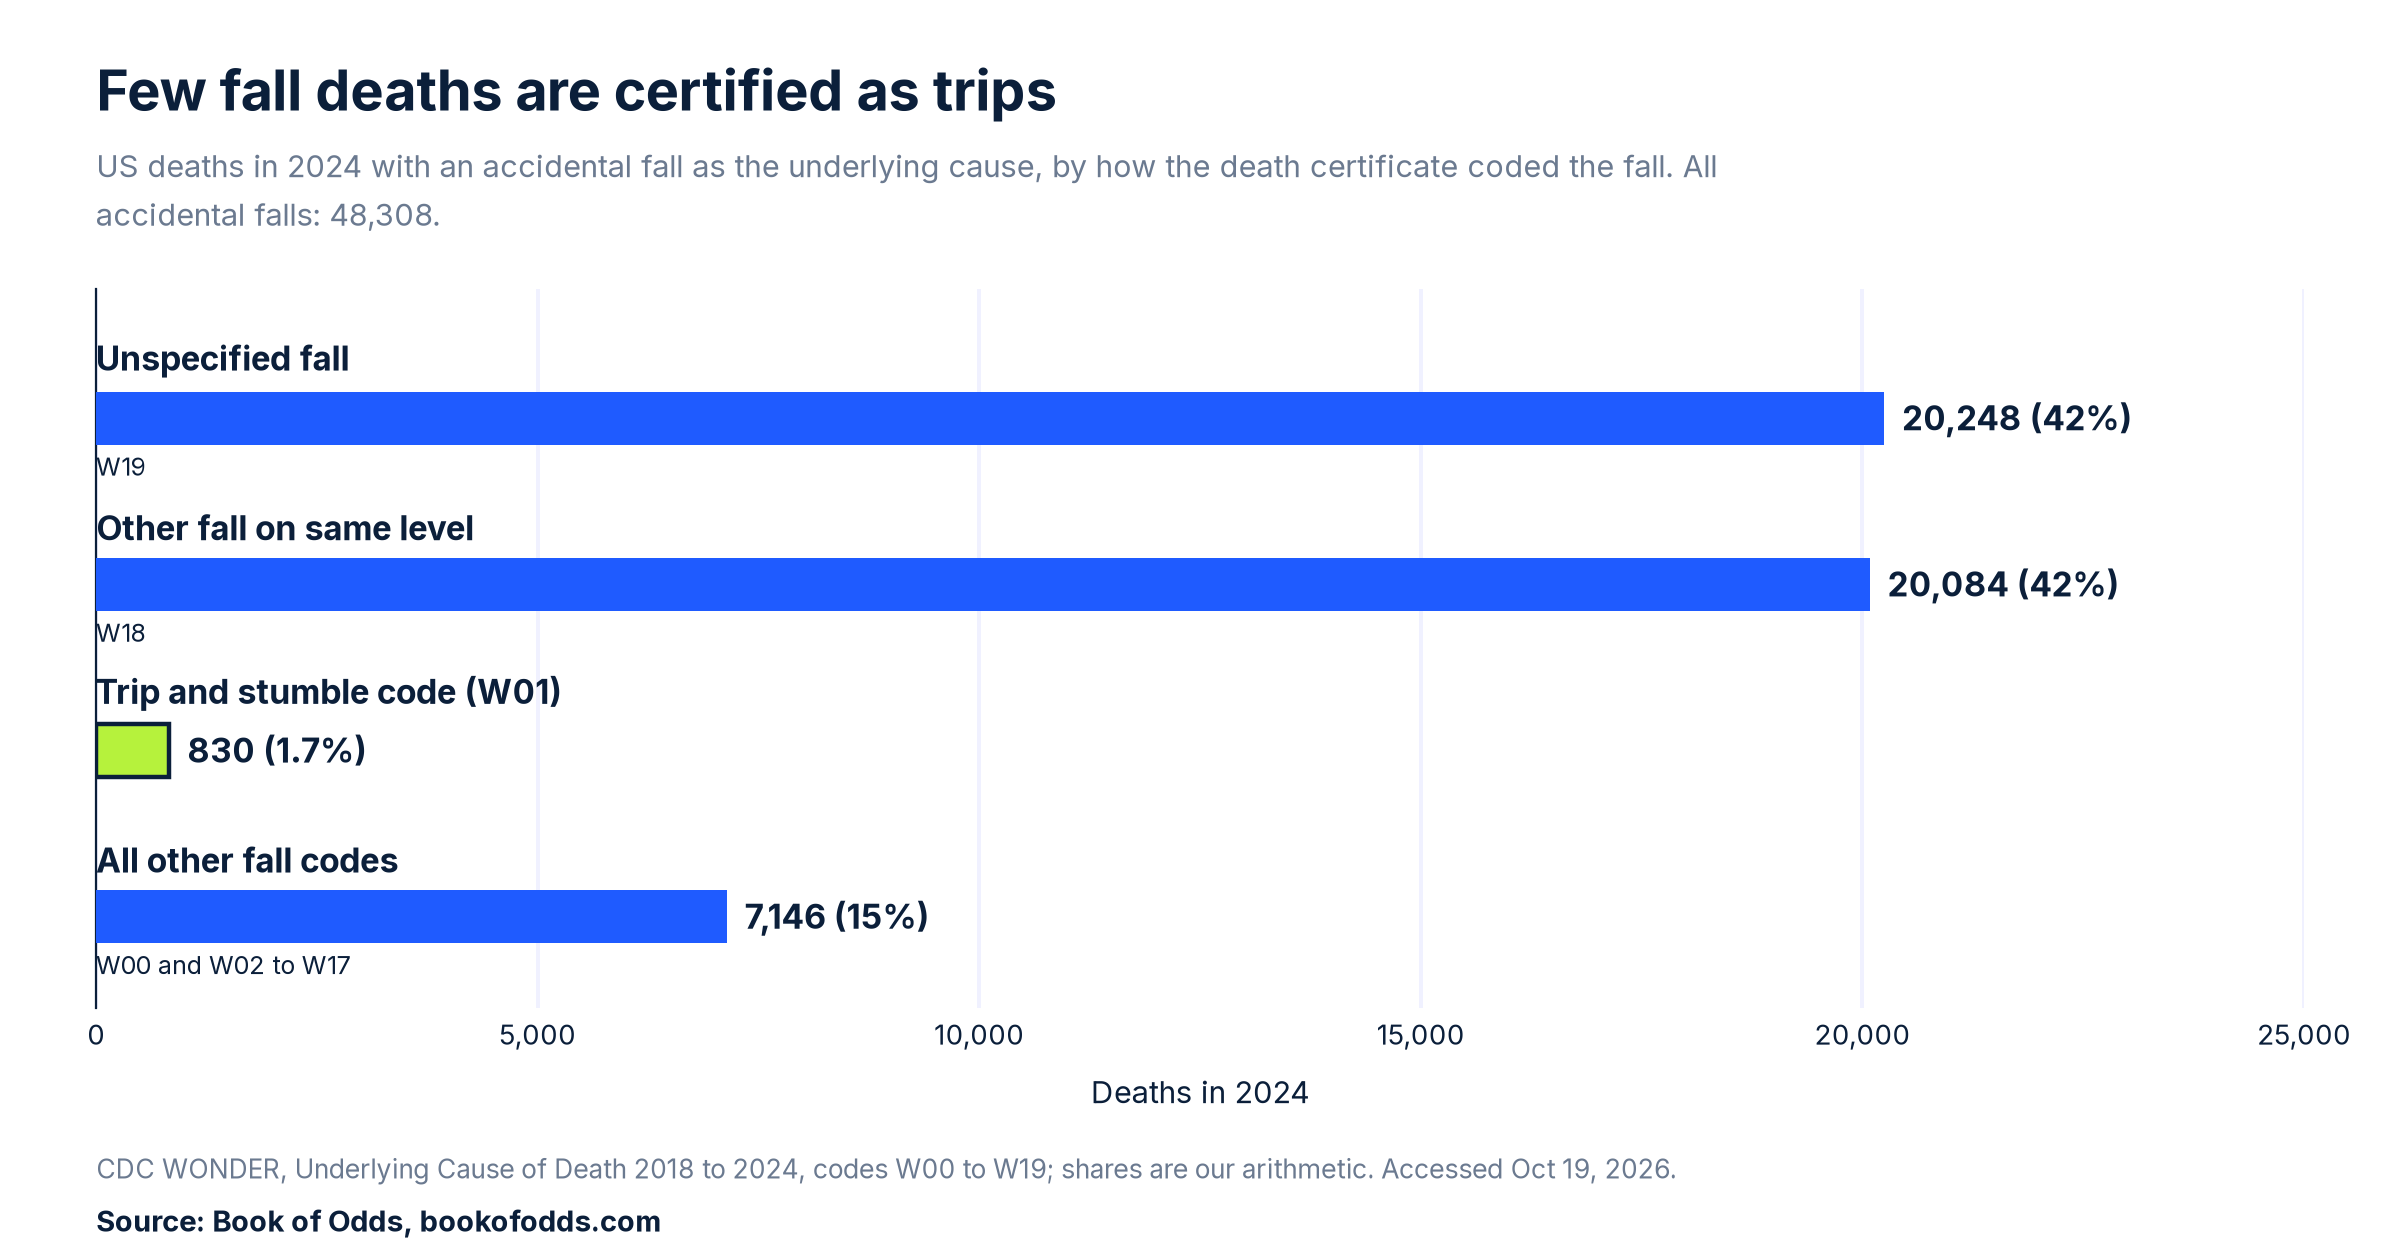
Accidental falls of every kind killed 48,308 US residents in 2024, about 1 in 7,040, or about 58 times the trip count. Most of those certificates use one of two broad codes: “Other fall on same level” (20,084 deaths) or “Unspecified fall” (20,248). Together they make up about 83% of all fall deaths, while falls certified under the trip code are about 1.7%. Every other fall code combined, from beds and ladders to stairs, accounts for 7,146, about 15%.
Our inference: a trip can end up on a death certificate as a plain fall on level ground or an unspecified fall, so 830 counts only the deaths certified specifically under the trip code, and the true number of deaths that began with a trip is not known and is probably larger. The coding manual, in other words, is better at tidiness than at storytelling.

Who dies
Trip code deaths are concentrated at the oldest ages. Of the 830 in 2024, 393 were people 85 and older, 260 were 75 to 84 and 119 were 65 to 74. That puts about 93% of the total at 65 or older, and about 47% at 85 or older. Among people 85 and older, the rate was 6.1 per 100,000, about 1 in 16,400. Younger groups are small: 33 deaths at 55 to 64 and 13 at 45 to 54, and CDC withholds the counts for most ages under 45 because they are so low.
Accidental falls of every kind follow the same shape. Of the 48,308 fall deaths in 2024, 43,020, about 89%, were people 65 or older. For everyone 85 and older, the all falls rate was 338.0 per 100,000, about 1 in 296.
Seven years, one narrow range
The trip count has barely moved. Deaths coded W01 ran 778 in 2018, 793 in 2019, 791 in 2020, 934 in 2021, 900 in 2022, 834 in 2023 and 830 in 2024. The crude rate stayed at 0.2 to 0.3 per 100,000 every year. Because no age-adjusted rate was used, this page makes no claim about whether the risk is rising or falling.
Falls on ice and snow have their own code and their own page: see which Americans die from falls on ice.
Data limits
These are deaths of US residents with an accidental fall listed as the underlying cause on the death certificate, from CDC’s final 2024 mortality data. Code W01 counts only falls certified under the trip code, and most fall deaths carry a less specific code. None of the rates is adjusted for age, so the counts and crude rates should not be read as a trend in risk. CDC WONDER withholds counts of 9 or fewer, so some younger age groups are missing from the trip figures.
The short version
CDC counts 830 US deaths in 2024 under the trip code (W01), about 1 in 410,000 residents, out of 48,308 deaths from accidental falls of every kind. When CDC adds final data for 2025, this page will be rechecked against it.
Last checked: 2026-10-19, against CDC WONDER, Underlying Cause of Death 2018 to 2024 (ICD-10 W00 to W19). This article was machine-checked against the sources above and has not been expert-reviewed. Spotted an error or a newer public figure? Please tell us on our contact page with the article link and we will review it.
Sources
- S1 CDC, National Center for Health Statistics, National Vital Statistics System, Mortality 2018 to 2024 on CDC WONDER Online Database, released in 2026: Underlying Cause of Death 2018 to 2024, Single Race, ICD-10 W00 to W19, by year, code and ten year age group. https://wonder.cdc.gov/ucd-icd10-expanded.html . Accessed Oct 19, 2026.
- Method: the “1 in” odds, the shares (83%, 1.7%, 15%, 93%, 47%, 89%), the 7,146 for all other codes and the “about 58 times” comparison are Book of Odds arithmetic from the CDC counts above.