

In 2024, about how many Americans died after being struck by a thrown, projected or falling object: about 80, about 800 or about 8,000?
About 800. CDC records 819 such deaths in 2024, roughly 1 in 415,000 US residents, by our arithmetic (CDC WONDER).
That count covers deaths the certificate put down to being struck by a thrown, projected or falling object, which is ICD-10 code W20, listed as the underlying cause of death for a US resident in 2024. Because the code includes thrown and projected objects too, this page says “struck by an object” for the count, rather than claiming that every one of the 819 dropped from above. The odds divide those deaths by the US population in the same CDC table, and nothing here is adjusted for age. Gravity gets the headline, but it shares the code.
A near tie with tripping
That is almost exactly as many as the 830 deaths that same year, in the same CDC file, whose certificates gave code W01, a fall on level ground from slipping, tripping or stumbling; see how many people die from tripping.
Who dies
To get numbers big enough to break down, the rest of this page pools the seven years from 2018 to 2024, which together count 5,354 deaths from being struck by an object. Men were 4,777 of them, about 89%, and women 577. Worked out per person, that is about 1 in 240,000 men a year, against about 1 in 2 million women a year, both by our arithmetic. The data say who, not why, and this page leaves it there.
By age
The count peaks at ages 55 to 64, with 1,128 of the 5,354 deaths, about 21%. People 55 and older account for about half of all the deaths, 51%.

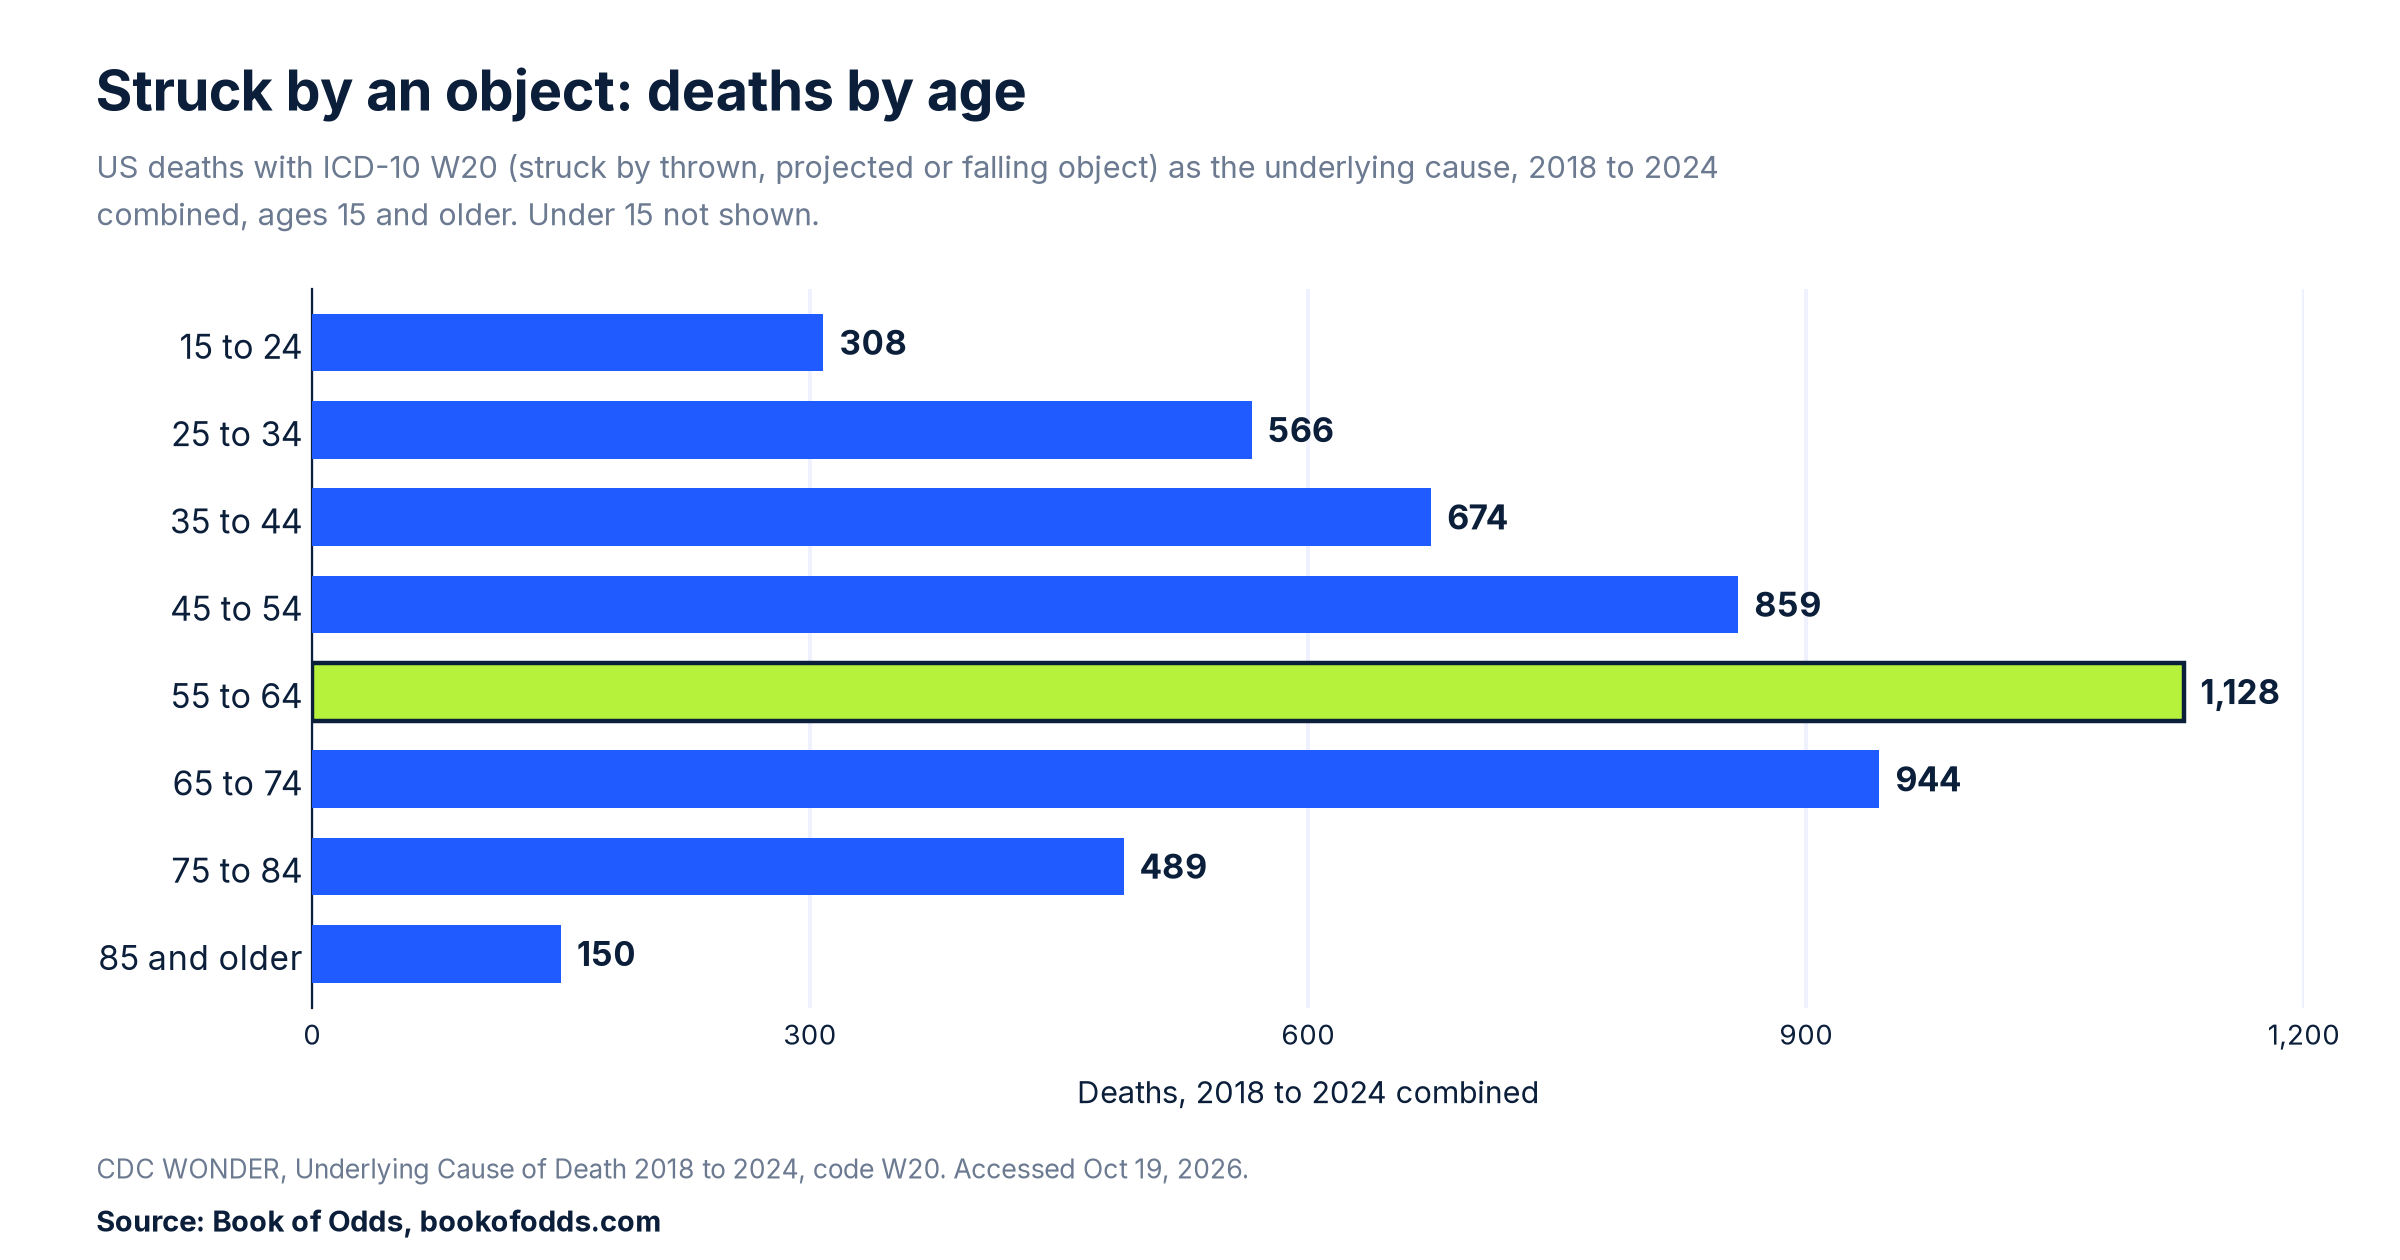
The rate tells a flatter story than the count. At 55 to 64, 65 to 74 and 75 to 84, the rate rounds to the same figure, 0.4 deaths per 100,000 people a year, so the peak in the count is not a sharp peak in risk. At 85 and older it is 0.3, and at 25 to 34 and 35 to 44 it is 0.2. The chart starts at age 15, because CDC withholds the count for babies under 1 and showing every younger group beside the total would give it away.
Seven years, one narrow range
Year by year, the count has stayed in a narrow band: 657 in 2018, 727 in 2019, 711 in 2020, 838 in 2021, 751 in 2022, 851 in 2023 and 819 in 2024. That averages about 765 deaths a year, and the crude rate stayed at 0.2 to 0.3 per 100,000 in every year. No age-adjusted rate is used here, so the page makes no claim about whether the risk is rising or falling.
Data limits
These are deaths of US residents with W20 listed as the underlying cause on the death certificate, from CDC’s final 2024 mortality data. The code includes thrown and projected objects as well as falling ones, and how certifiers sort borderline cases is not known. None of the rates is adjusted for age. CDC WONDER withholds counts of 9 or fewer, so one age group, babies under 1, is missing. The space debris figure is an undated model estimate of injury, not a count.
The short version
CDC counts 819 US deaths in 2024 from being struck by a thrown, projected or falling object, about 1 in 415,000 residents by our arithmetic, with men about 89% of such deaths from 2018 to 2024. When CDC adds final data for 2025, this page will be rechecked against it.
Last checked: 2026-10-19, against CDC WONDER, Underlying Cause of Death 2018 to 2024 (ICD-10 W20), The Aerospace Corporation’s Space Debris 101 and NASA’s Orbital Debris Program Office FAQ. This article was machine-checked against the sources above and has not been expert-reviewed. Spotted an error or a newer public figure? Please tell us on our contact page with the article link and we will review it.
Sources
- S1 CDC, National Center for Health Statistics, National Vital Statistics System, Mortality 2018 to 2024 on CDC WONDER Online Database, released in 2026: Underlying Cause of Death 2018 to 2024, Single Race, ICD-10 W20, by year, by ten year age group and by sex. https://wonder.cdc.gov/ucd-icd10-expanded.html . Accessed Oct 19, 2026.
- S2 The Aerospace Corporation, “Space Debris 101” (no date printed), section “What is the risk to people on the ground?”. https://aerospace.org/article/space-debris-101 . Accessed Oct 19, 2026.
- S3 NASA Orbital Debris Program Office, “Frequently Asked Questions”, Q13. https://orbitaldebris.jsc.nasa.gov/faq/ . Accessed Oct 19, 2026.
- Method: the “1 in” odds (including the men’s and women’s figures), the shares, the yearly average and the comparison with the trip count are Book of Odds arithmetic from the CDC counts. The space debris figure is The Aerospace Corporation’s estimate.