

For any one US baby, which is slightly more likely: a boy, a girl, or exactly even odds?
A boy, barely. Of 3,628,934 US births in 2024, 1,853,969 were boys, or 51.1%. By our arithmetic from CDC’s final 2024 data, that is about 1,045 boys for every 1,000 girls (CDC WONDER natality).
That figure comes from CDC’s final 2024 natality data, which counts every registered birth certificate in the country, so it is a full count rather than a survey. It counts births, not families. The streak odds below are our arithmetic, under the textbook assumption that each birth is independent at those national shares.
After two boys, what are the chances of a girl?
Under that textbook model, about 48.9%, the same as for any single birth. A coin has no memory, and in this model neither does the next birth. None of our sources gives a measured “girl after exactly two boys” figure, so this is the model’s answer, not an observed rate.
There is some support for the model at this size. A 2025 study of about 58,000 US mothers from the Nurses’ Health Studies, not a random sample of US families, found what it called an “exceptionally good fit” of a simple coin-toss model to the first two children in all its families.
Two and three in a row
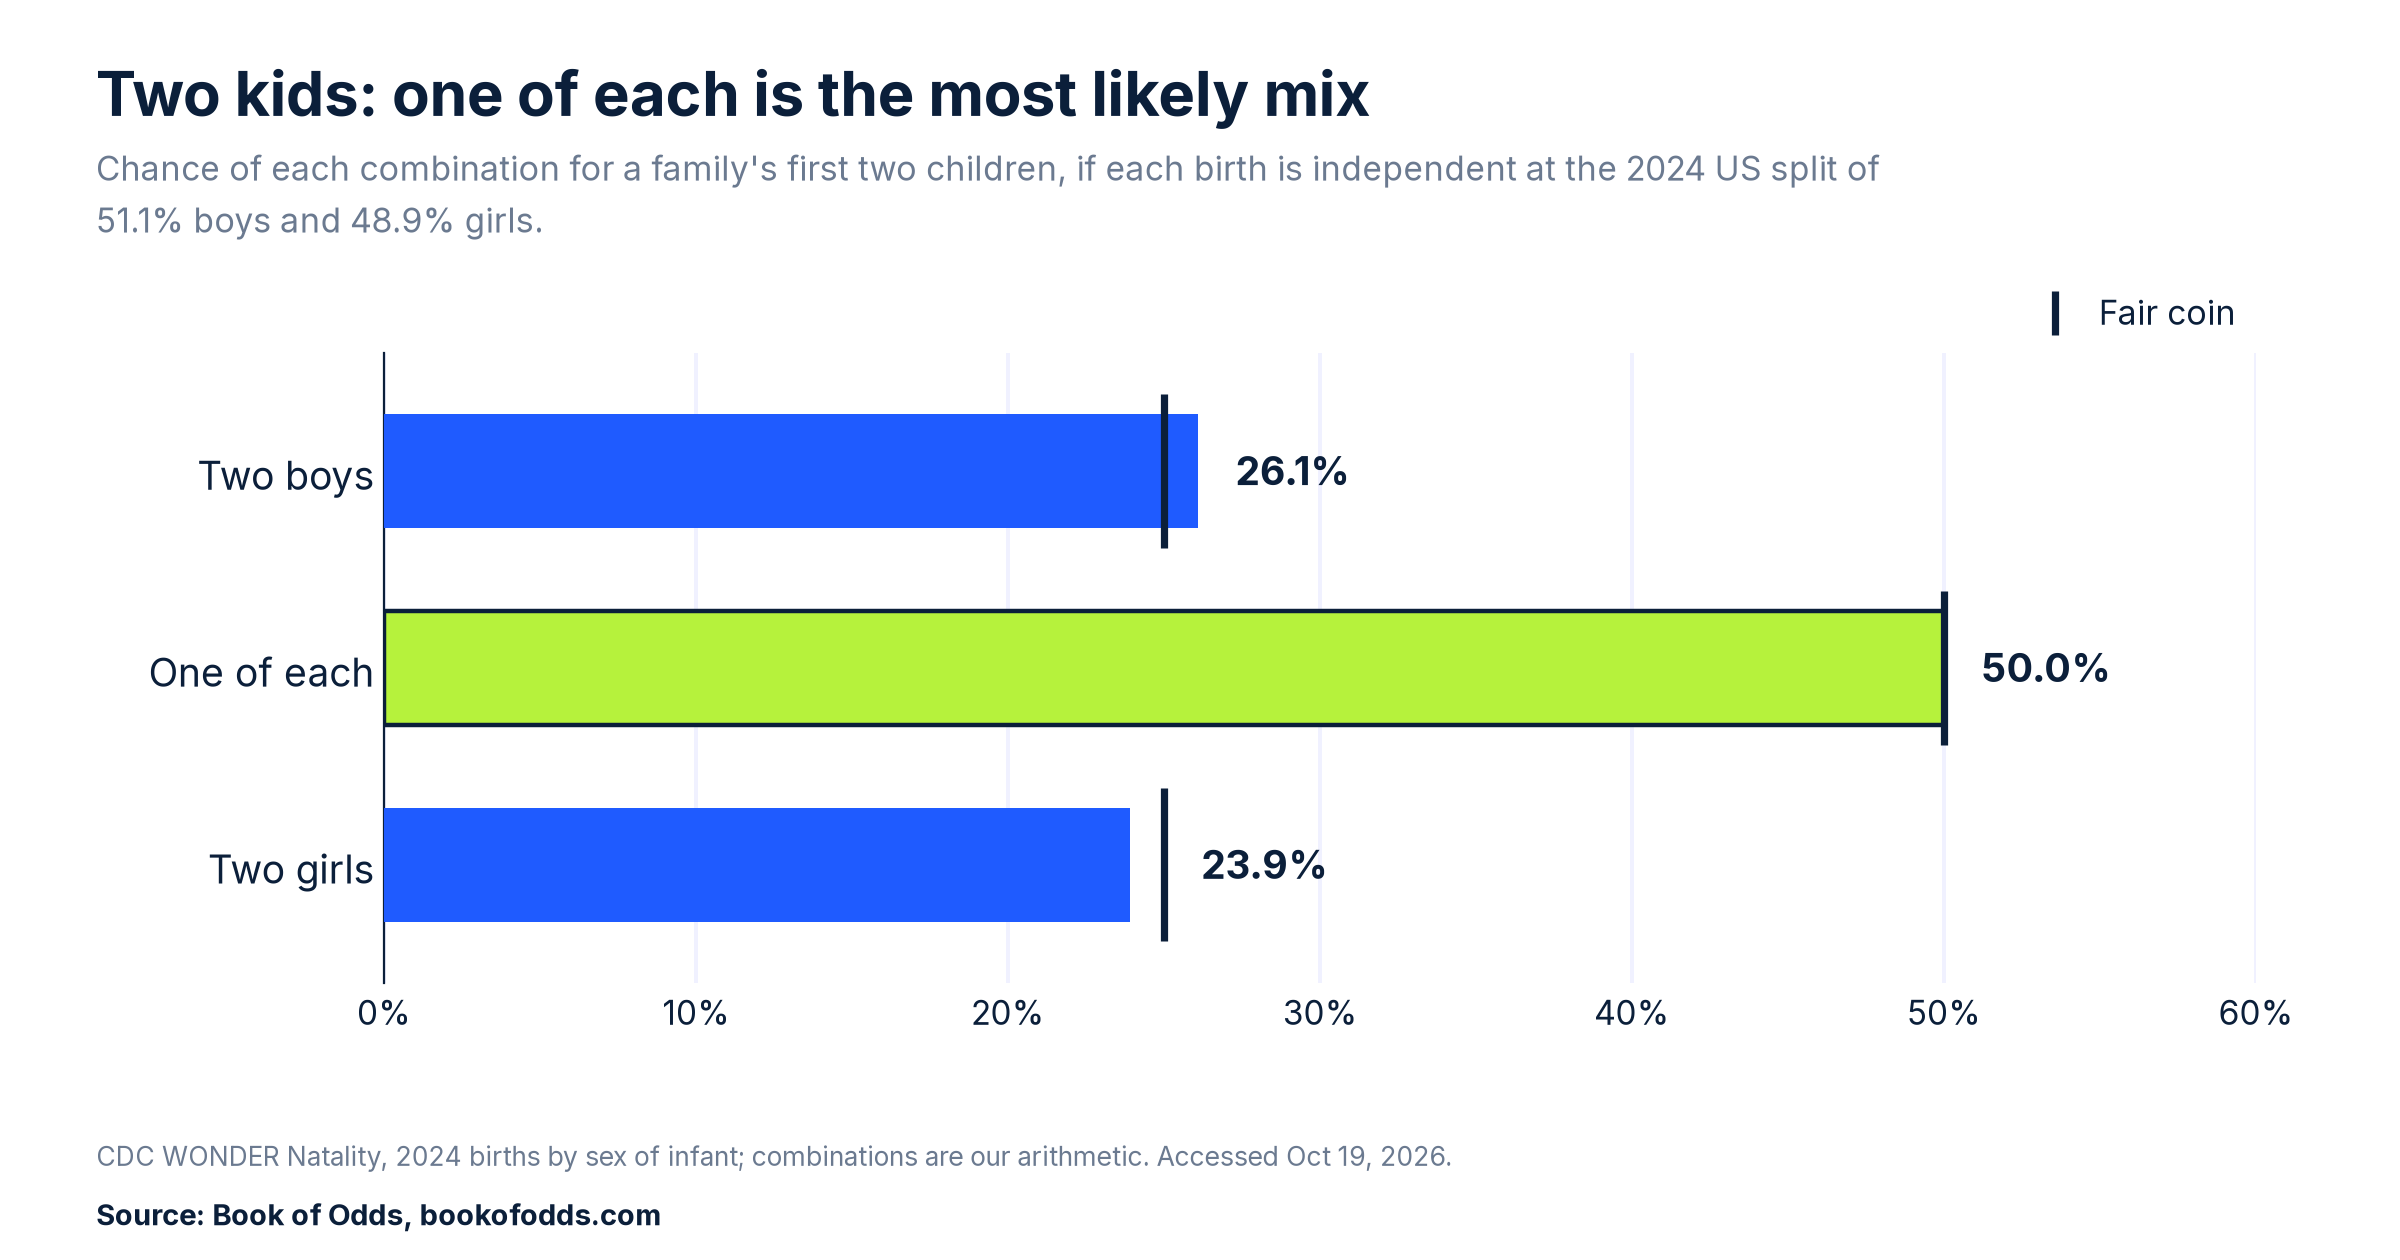
If each birth is independent at the 2024 shares, a family’s first two children are both boys about 26.1% of the time (about 1 in 3.8), one of each 50.0% of the time and both girls about 23.9% of the time (about 1 in 4.2). A fair coin would give 25%, 50% and 25%.

Stretch it to three. Under the same model, three boys in a row comes out at about 13.3% (about 1 in 7.5) and three girls at about 11.7% (about 1 in 8.5), against 12.5% (1 in 8) for a fair coin. The small tilt toward boys adds up a little with each birth, but three boys in a row, or three girls in a row, is still roughly a one in eight event. Three of the same sex either way comes out at about 25.0%, or 1 in 4 (our arithmetic). The model stops at three on this page, for a reason that comes next.
The weighted coin
In that one study of nurses’ families, which is not a probability sample, sex at birth did not follow a simple coin toss once families grew larger. The authors found a pattern “akin to a weighted coin toss”, in which “each family may have a unique probability of male or female births”. Their fitted model put the chance of another boy, for mothers who already had three boys, at 61%, and the chance of another girl after three girls at 58%.
Those figures cannot be applied to every US family, and the study says why in its own data. The mothers were nurses in two research cohorts, not a random sample, and 95.4% were white. The births were reported by the mothers, for 1956 to 2015. The study’s own sex ratio was 1.08 boys per girl, higher than the national 2024 figure of about 1.045 from our arithmetic. The authors also write that they “did not collect information about biological fathers”, and that statistical power was limited for families with more than three children. The 61% is a finding about one group of families, measured with a model, not a national rate.
Data limits
The national figure counts births, not families, so it cannot show streaks directly. The two and three in a row figures are a model that assumes each birth is independent at the 2024 shares. The 2025 study is not a probability sample: it is mother-reported, drawn from cohorts of nurses, mostly white, has its own sex ratio of 1.08 and has no data on fathers. Its 61% and 58% are model estimates, with limited statistical power past three children.
The short version
About 51.1% of US babies born in 2024 were boys, about 1,045 for every 1,000 girls by our arithmetic from CDC’s final count. For most families, by the national count, each birth is nearly a coin toss, and three boys in a row, or three girls in a row, is roughly 1 in 8 under the textbook model. One study of nurses’ families, not a random sample, found the coin may be weighted in larger families.
Last checked: 2026-10-19, against CDC WONDER natality data for 2024, NCHS’s Births: Final Data for 2024 (June 2026) and Wang et al., Science Advances, 2025. This article was machine-checked against the sources above and has not been expert-reviewed. Spotted an error or a newer public figure? Please tell us on our contact page with the article link and we will review it.
Sources
- S1 CDC, National Center for Health Statistics, National Vital Statistics System, Natality on CDC WONDER Online Database, Natality 2016 to 2024 expanded, final 2024 births grouped by sex of infant. https://wonder.cdc.gov/natality-expanded-current.html . Accessed Oct 19, 2026.
- S2 Wang S, et al., “Is sex at birth a biological coin toss? Insights from a longitudinal and GWAS analysis”, Science Advances 11(29):eadu7402, July 18, 2025, doi:10.1126/sciadv.adu7402. https://pmc.ncbi.nlm.nih.gov/articles/PMC12273753/ . Accessed Oct 19, 2026. Not a probability sample.
- S3 CDC, National Center for Health Statistics, Osterman MJK, et al., “Births: Final Data for 2024”, National Vital Statistics Reports 75(2), June 9, 2026. https://www.cdc.gov/nchs/data/nvsr/nvsr75/nvsr75-02.pdf . Accessed Oct 19, 2026.
- Method: the shares, the “about 1,045 boys for every 1,000 girls” ratio, the “1 in” odds and the streak percentages are Book of Odds arithmetic from the 2024 CDC counts, under a model that assumes each birth is independent.