

In 2024, what were the odds that a person in the US died in a motor vehicle traffic crash: about 1 in 870, about 1 in 8,700 or about 1 in 87,000?
About 1 in 8,700 for the year (our arithmetic). NHTSA counted 39,254 motor vehicle traffic deaths in the US in 2024. Divide that by the 340,110,988 people NHTSA uses for the 2024 US population and you get about 11.5 deaths per 100,000 people, or about 1 in 8,700 per year.
The count comes from NHTSA’s Fatality Analysis Reporting System (FARS), 2024 Annual Report File. It includes people killed in crashes involving a motor vehicle on a public road who died within 30 days of the crash, and NHTSA will replace the 2024 file with a final one. On this page “car crash” covers all of that: the figures are all US motor vehicle traffic deaths, including drivers and passengers of every vehicle type, motorcyclists, and pedestrians and cyclists killed in those crashes.
By age
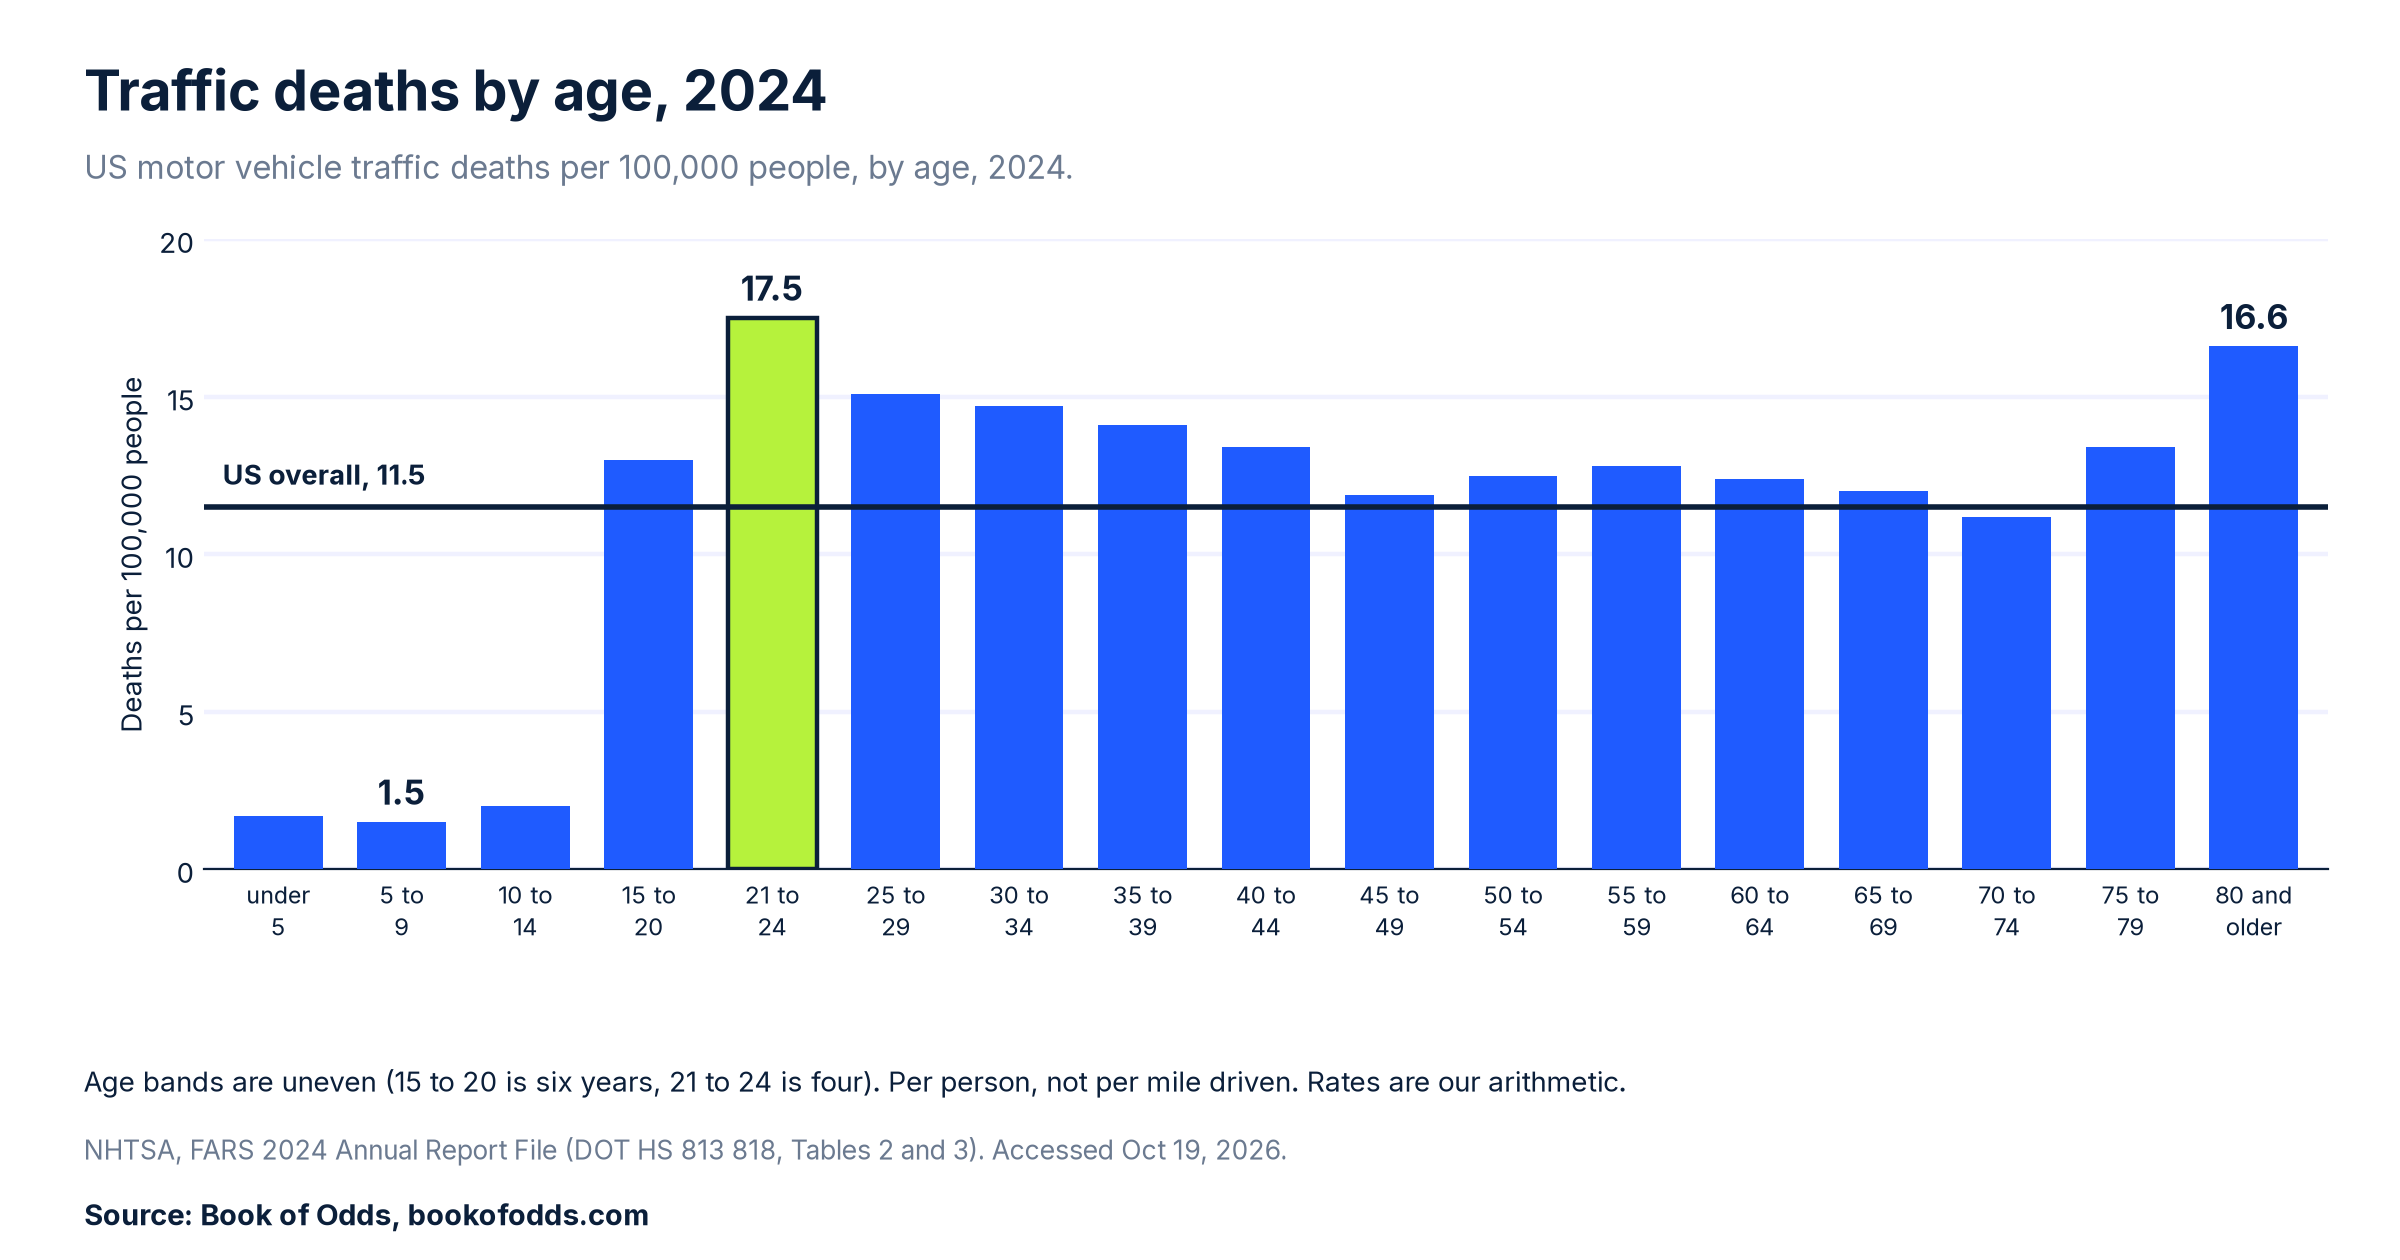
The highest US traffic death rate by age in 2024 belonged to ages 21 to 24: about 17.5 deaths per 100,000 people, or about 1 in 5,700 for the year (our arithmetic, as are all the rates by age). Next in 2024 came people 80 and older, at about 16.6 per 100,000, and ages 25 to 29, at about 15.1. Children 14 and under had the lowest rate in 2024, about 1.7 per 100,000. The 2024 rate at ages 21 to 24 was about 10 times the rate for children 14 and under (our arithmetic).
These are deaths per person in each age group, not per mile driven. NHTSA’s age bands are also uneven (15 to 20 covers six years, 21 to 24 covers four), so the fair comparison is between rates, not counts.

Men and women
Of the 39,254 people killed in US traffic crashes in 2024, 28,385 were men and 10,764 were women; the other 105 were of unknown sex. That is about 16.9 deaths per 100,000 men (about 1 in 5,900) and about 6.3 per 100,000 women (about 1 in 16,000) for 2024 (our arithmetic). That puts the men’s rate at about 2.7 times the women’s (our arithmetic).
Who was killed
In 2024, NHTSA counted 24,473 vehicle occupants killed in US traffic crashes, about 7.2 per 100,000 people in the US (our arithmetic). The same 2024 crashes killed 7,080 pedestrians (2.08 per 100,000 people in the US, NHTSA’s own figure), 6,228 motorcyclists and 1,103 cyclists. Per 100,000 people in the US, that is about 1.8 for motorcyclists and about 0.3 for cyclists (our arithmetic).
Each of those rates divides by everyone in the US, not by riders or walkers. Only some people ride motorcycles or bicycles, so these per person rates understate a rider’s own risk (our inference); they are not a motorcyclist’s or a cyclist’s odds. On a different basis, per 100 million vehicle miles traveled, NHTSA’s “Motorcycles: 2024 Data” report puts the 2024 death rate at 28.00 for motorcyclists and 1.05 for passenger car occupants.
A lifetime
One separate figure covers a whole lifetime, and it comes from the National Safety Council, not from NHTSA. NSC’s lifetime odds of dying in a motor vehicle crash, using 2024 data: estimated, about 1 in 101. It is an NSC estimate built from NCHS death records for 2024 and Census Bureau population and life expectancy data, on NSC’s own base rather than the FARS count, so the two are not compared here. NSC adds that its odds “are statistical averages over the U.S. population. They do not reflect the odds of death for a particular person from a particular cause, which varies significantly based on lifestyle, occupation, residence, and many other factors.”
Why the numbers differ
CDC counted 41,241 motor vehicle traffic deaths in 2024, or 12.1 per 100,000 people. That is a different record. CDC’s figure comes from death certificates of US residents, by calendar year of death, and CDC lists it with its unintentional injury deaths. FARS counts deaths in crashes on public roads where the person died within 30 days. Different rules give different totals, which is why every headline figure on this page comes from FARS alone.
What 2025 may look like
NHTSA projects 36,640 traffic deaths in the US in 2025. That is a statistical projection, not a count; NHTSA’s final 2024 file and its first 2025 file are due in early 2027.
Data limits
Every headline figure here covers one year, 2024, and one record, NHTSA’s FARS Annual Report File, which is subject to change. The rates are per person in the US, not per mile or per rider, so none of them is any one person’s odds. CDC and NSC count on other bases and get other totals, and we do not mix them in one ranking. The lifetime figure is NSC’s estimate, and the 2025 figure is a projection until final counts arrive.
The short version
In 2024, NHTSA counted 39,254 motor vehicle traffic deaths in the US: about 11.5 per 100,000 people, or about 1 in 8,700 for the year (our arithmetic). NHTSA’s final 2024 file and its 2025 count may update this page.
Last checked: 2026-10-19, against NHTSA’s 2024 traffic safety reports and 2025 early estimate, the National Safety Council’s Odds of Dying and CDC’s FastStats. This article was machine-checked against the sources above and has not been expert-reviewed. Spotted an error or a newer public figure? Please tell us on our contact page with the article link and we will review it.
Sources
- S1 NHTSA, “Overview of Motor Vehicle Traffic Crashes in 2024,” DOT HS 813 791, April 2026 (FARS 2024 Annual Report File). https://crashstats.nhtsa.dot.gov/Api/Public/ViewPublication/813791 . Accessed Oct 19, 2026.
- S2 NHTSA, “Pedestrians: 2024 Data,” DOT HS 813 818, Tables 2 and 3 (deaths and population by age and sex). https://crashstats.nhtsa.dot.gov/Api/Public/ViewPublication/813818 . Accessed Oct 19, 2026.
- S3 NHTSA, early estimate of motor vehicle traffic fatalities in 2025, DOT HS 813 800. https://crashstats.nhtsa.dot.gov/Api/Public/Publication/813800 . Accessed Oct 19, 2026.
- S4 National Safety Council, Injury Facts, “Odds of Dying (2024 Data).” The live NSC page was not reachable on Oct 19, 2026, so the NSC odds on this page come from an archived copy of the NSC page dated Sep 7, 2026 (Internet Archive). The caveat quote is from NSC’s Odds of Dying resource page. Live page: https://injuryfacts.nsc.org/all-injuries/preventable-death-overview/odds-of-dying/ ; archived copy: https://web.archive.org/web/20260908000704/https://injuryfacts.nsc.org/all-injuries/preventable-death-overview/odds-of-dying/ . Accessed Oct 19, 2026.
- S5 CDC, National Center for Health Statistics, FastStats, “Accidents or Unintentional Injuries” (2024 mortality data). https://www.cdc.gov/nchs/fastats/accidental-injury.htm . Accessed Oct 19, 2026.
- S7 NHTSA, “Motorcycles: 2024 Data,” DOT HS 813 824, July 2026, Table 2 (rates per 100 million vehicle miles traveled). https://crashstats.nhtsa.dot.gov/Api/Public/ViewPublication/813824 . Accessed Oct 19, 2026.
- Method: the per 100,000 rates (except NHTSA’s pedestrian rate of 2.08), every “about 1 in N” figure, “about 10 times” and “about 2.7 times” are Book of Odds arithmetic from NHTSA’s 2024 counts and the population figures NHTSA uses.