The short answer
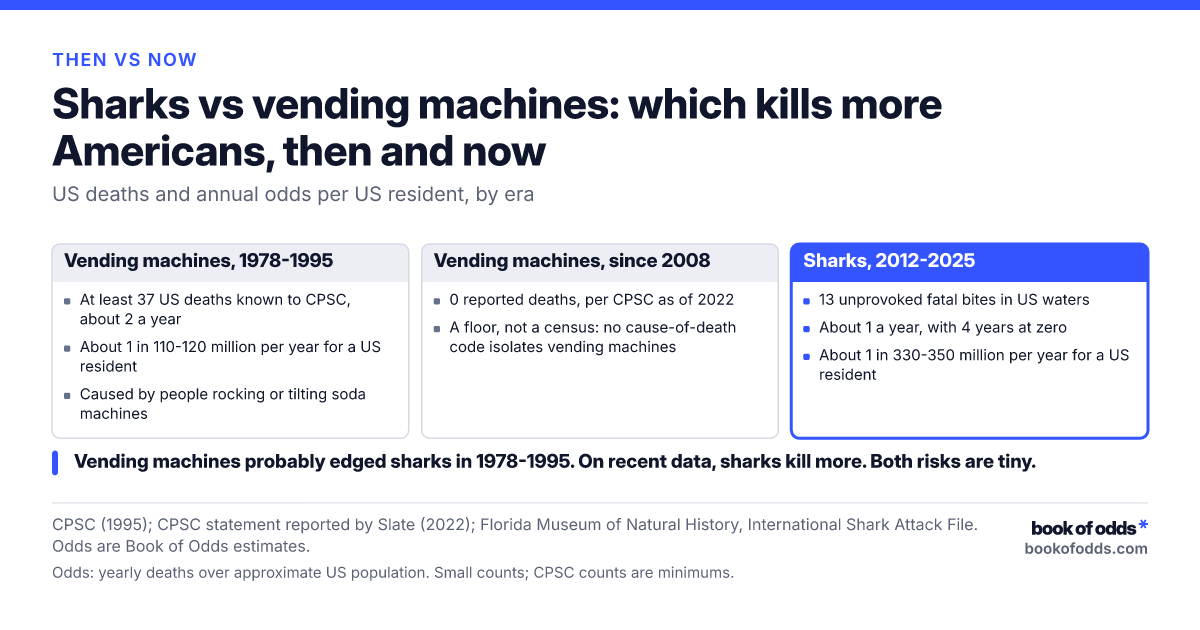
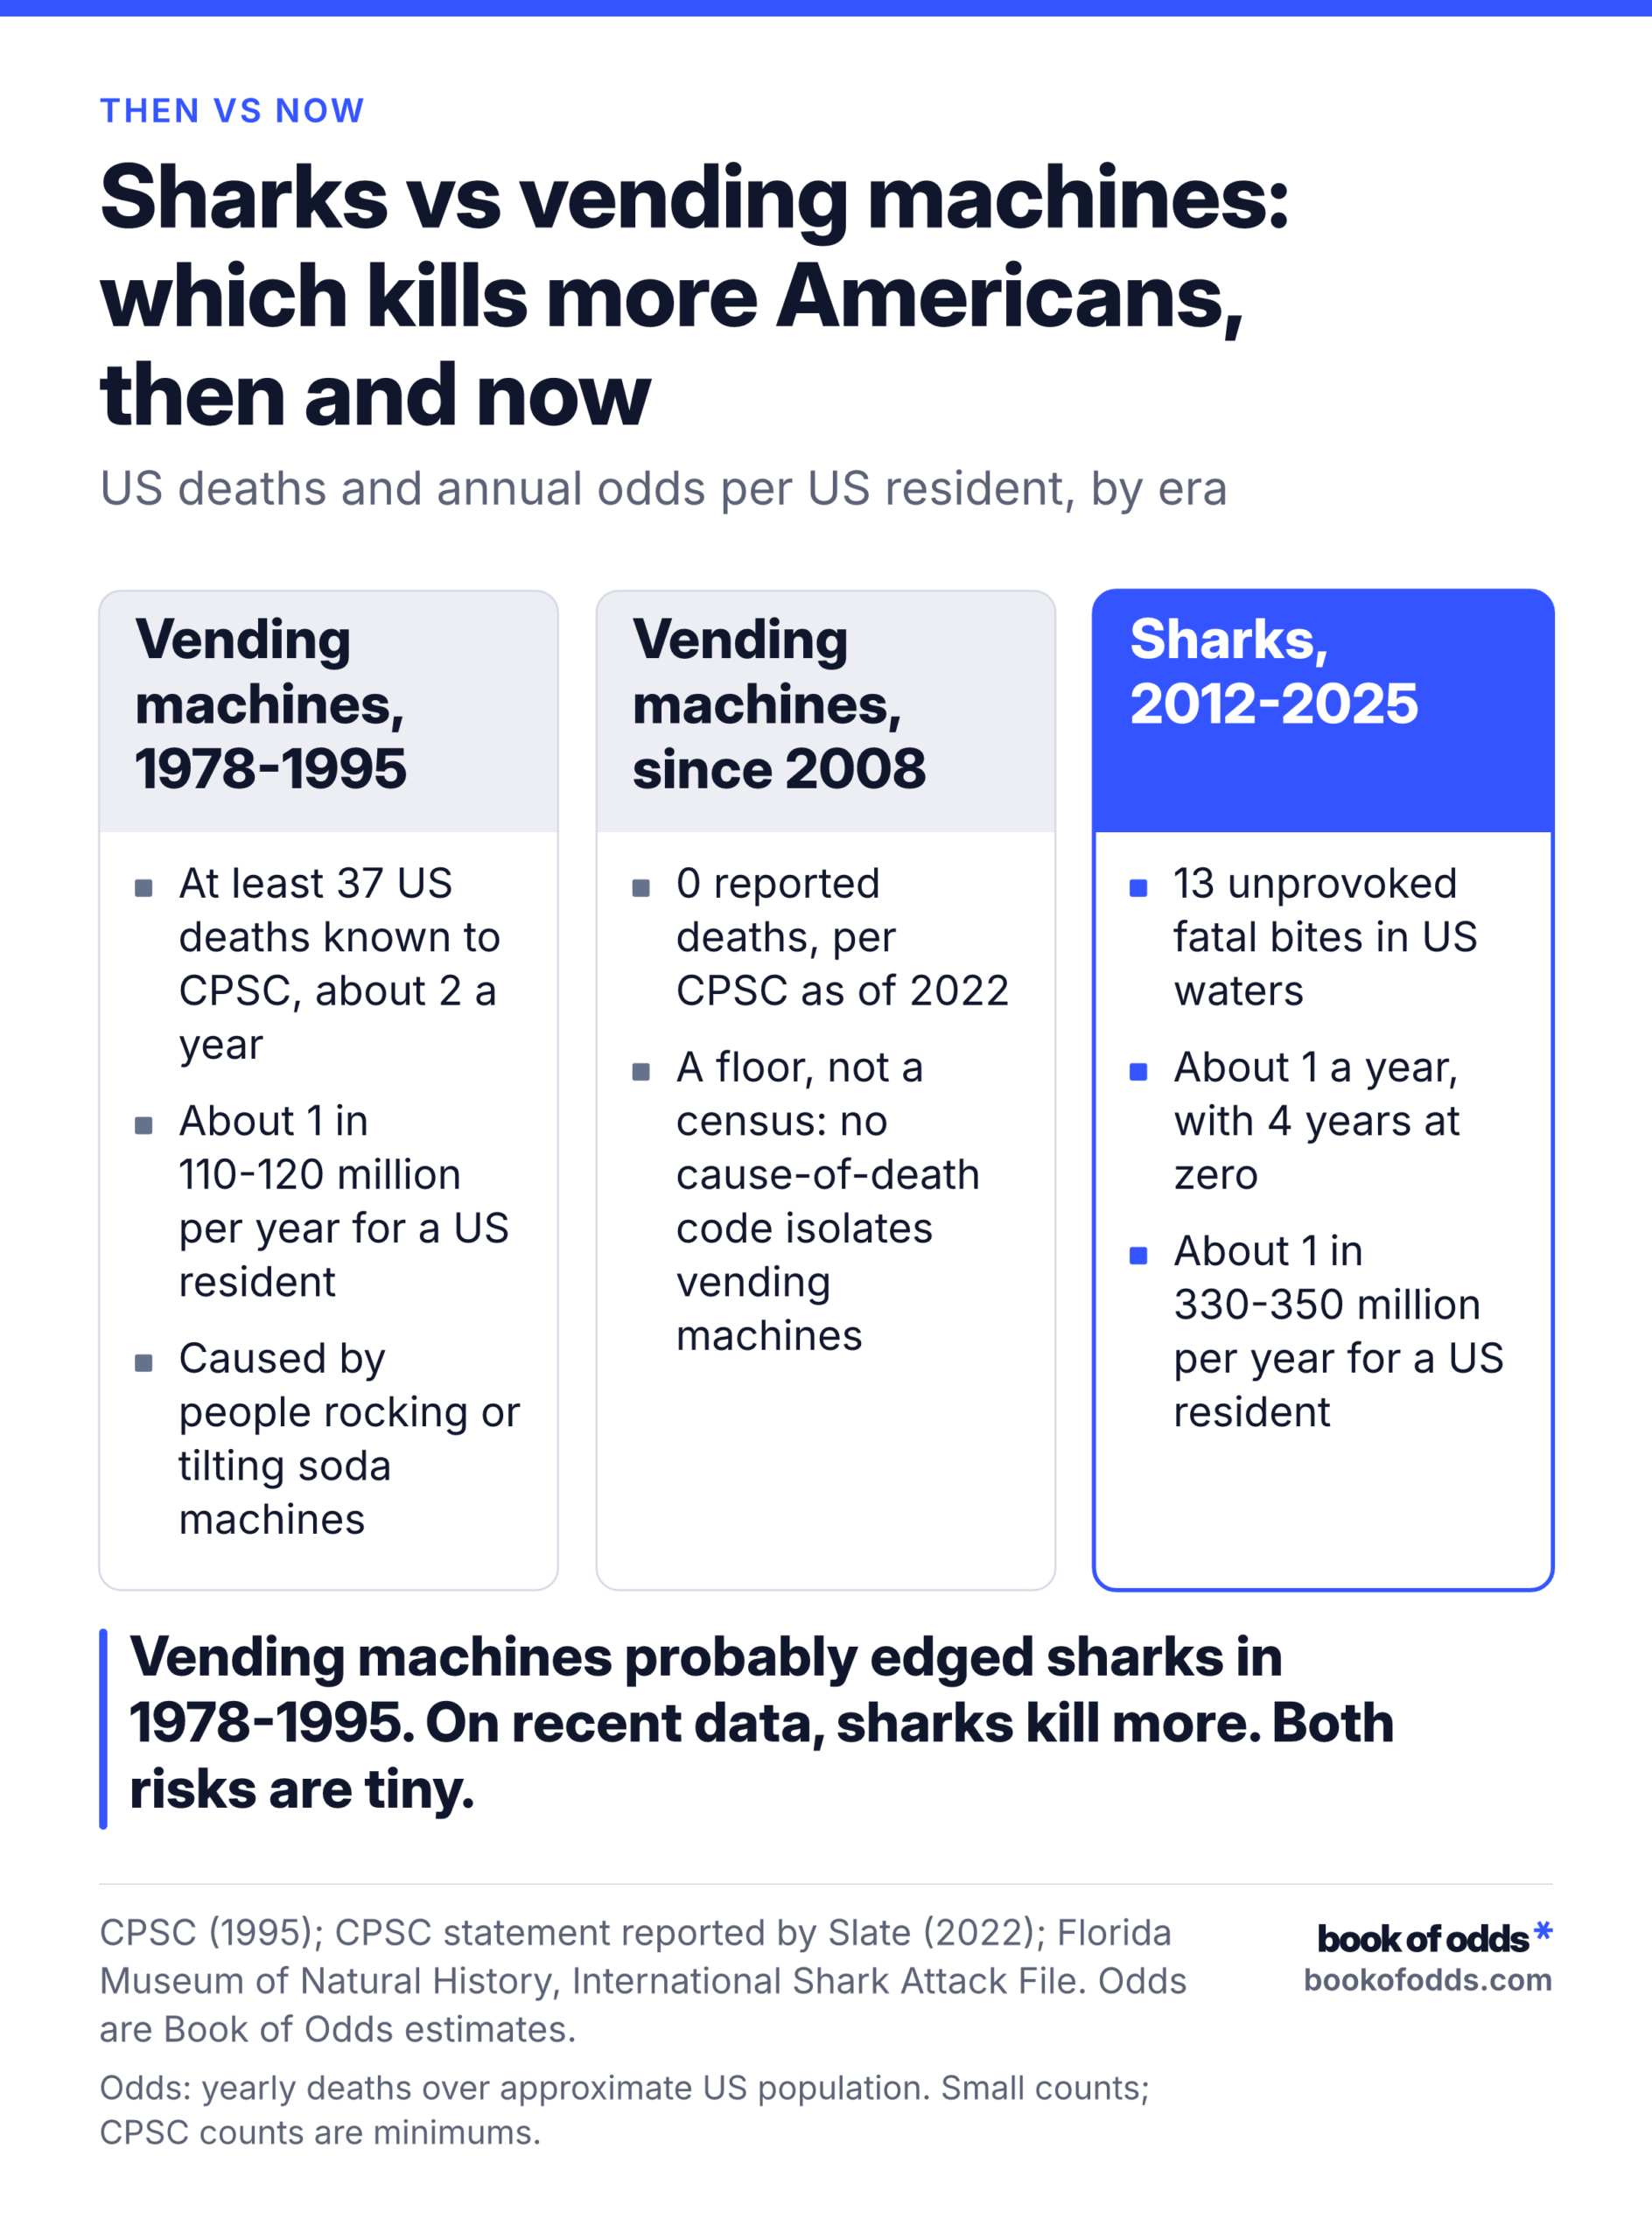
Not anymore. Vending machines probably did kill more Americans than sharks in the 1980s and early 1990s. On recent data, sharks kill more.
From 1978 to 1995, the US Consumer Product Safety Commission (CPSC) knew of at least 37 deaths from soda machines tipping onto people. That is about 2 a year. Spread across the whole US population, it works out to a chance of about 1 in 110-120 million per year for any one resident. In plain terms: each year, roughly one American in that many died under a vending machine.
Now the recent picture. The International Shark Attack File (ISAF) at the Florida Museum of Natural History counted 13 unprovoked fatal shark bites in US waters from 2012 to 2025. Thirteen deaths over 14 years is about 0.93 a year, so call it 1. For a US resident, that is a chance of about 1 in 330-350 million a year. Meanwhile, CPSC’s press secretary told Slate in 2022 that the agency had no reported vending machine death since 2008.
So the verdict you can repeat at dinner: vending machines then, sharks now. Both sit among the smallest risks you will ever read about.
Where the vending machine number comes from
The famous figure traces back to a 1995 CPSC release announcing an industry labeling campaign for soda vending machines. It said the agency knew of at least 37 deaths and 113 injuries since 1978. The cause was the same every time: people rocked or tilted a machine until it fell on them.
You can rebuild the annual chance yourself. Divide 37 deaths by the 18 years from 1978 to 1995 and you get about 2.06 deaths a year. The average US population over that stretch was about 242 million (Census Bureau estimates). Divide 242 million by 2.06 and you get roughly 1 death per 120 million residents a year. Count 17 years instead (1979 to 1995) and the answer becomes about 1 in 112 million. Hence the range: about 1 in 112-118 million per year.
Two cautions come with it. First, at least means 37 is a floor. CPSC counted the deaths it learned about; this was not a death-certificate count. Second, doctors saw the same pattern. A 1988 case series in JAMA described 15 young men, aged 15 to 24, who were hurt after rocking soda machines. Three of them died. The author also had reports of 11 deaths on military installations between December 1984 and July 1988.
Tip-overs belong to a bigger family of accidents: injuries and deaths from falling objects.
What happened to vending machine deaths
VENDING MACHINES
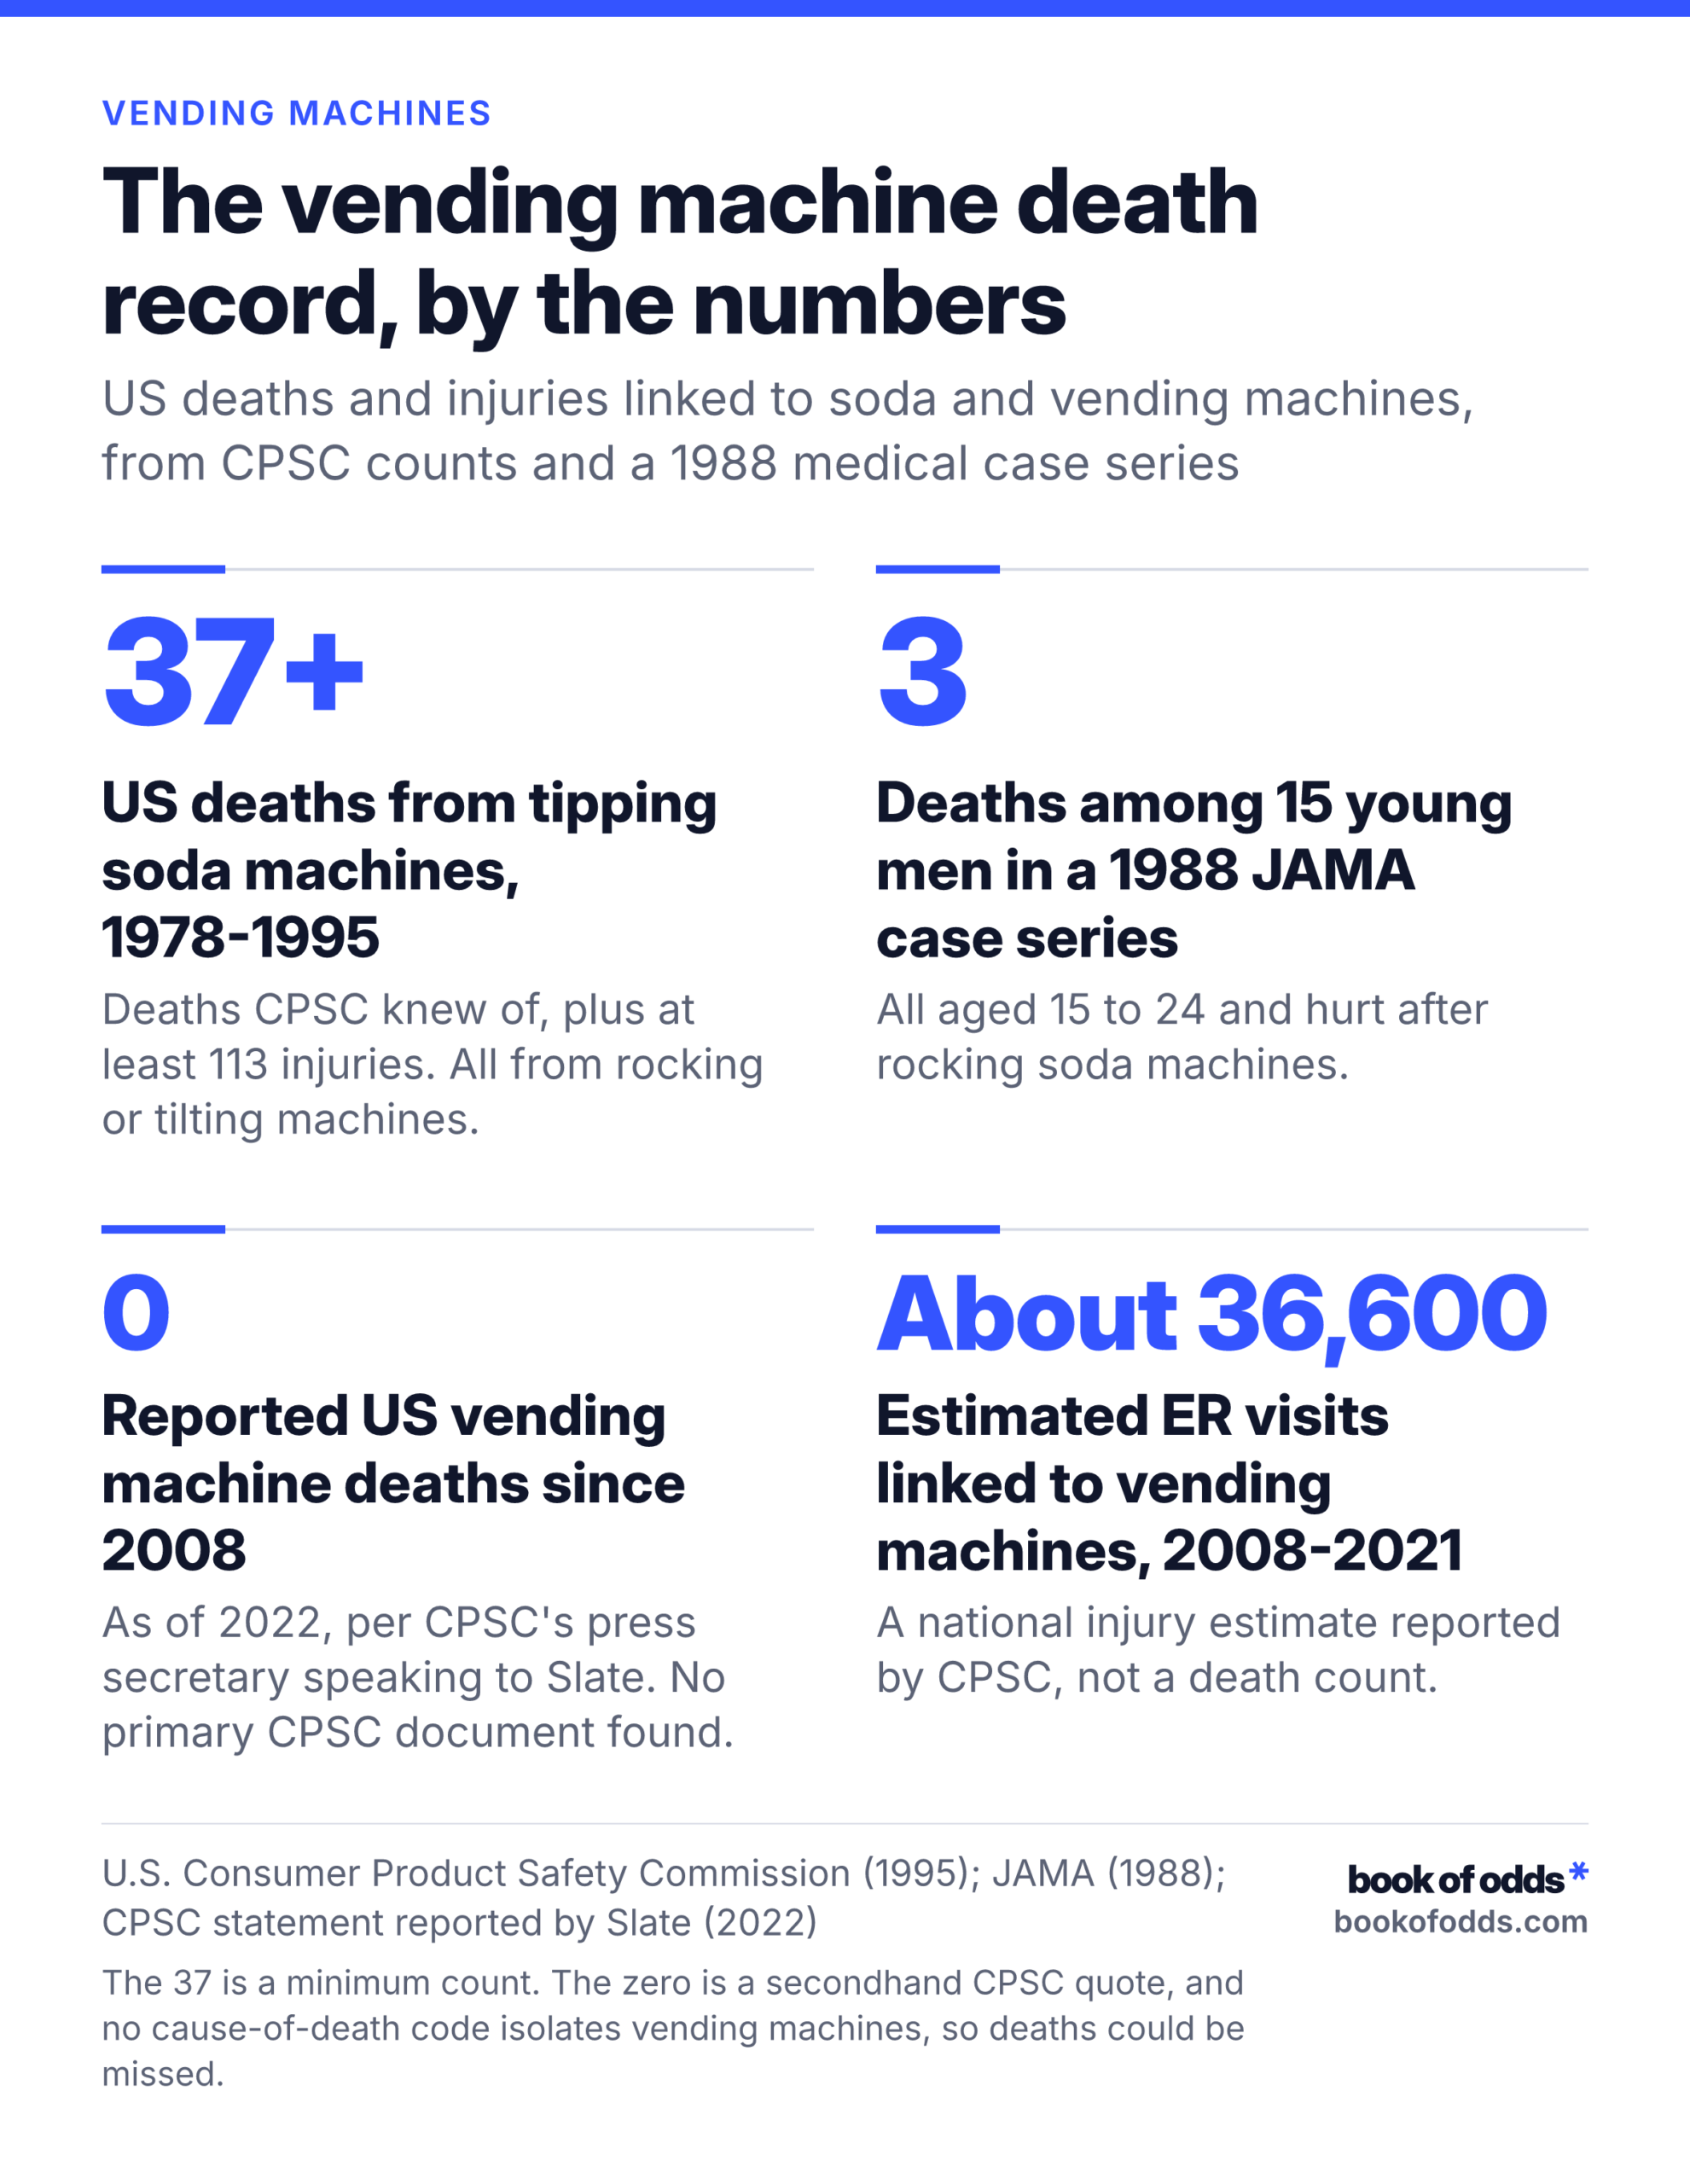
The vending machine death record, by the numbers
US deaths and injuries linked to soda and vending machines, from CPSC counts and a 1988 medical case series
- 37+ US deaths from tipping soda machines, 1978-1995 Deaths CPSC knew of, plus at least 113 injuries. All from rocking or tilting machines.
- 3 Deaths among 15 young men in a 1988 JAMA case series All aged 15 to 24 and hurt after rocking soda machines.
- 0 Reported US vending machine deaths since 2008 As of 2022, per CPSC's press secretary speaking to Slate. No primary CPSC document found.
- About 36,600 Estimated ER visits linked to vending machines, 2008-2021 A national injury estimate reported by CPSC, not a death count.
U.S. Consumer Product Safety Commission (1995); JAMA (1988); CPSC statement reported by Slate (2022)
The 37 is a minimum count. The zero is a secondhand CPSC quote, and no cause-of-death code isolates vending machines, so deaths could be missed.
Book of Odds bookofodds.com
Download image of The vending machine death record, by the numbers
They seem to have stopped, or at least stopped being reported. In 2022, CPSC’s press secretary told Slate the agency had no reported vending machine death since 2008. She also gave an estimate of about 36,600 emergency room visits associated with vending machines from 2008 to 2021. So the machines still hurt people. They just have not killed anyone CPSC knows about.
The 1995 labeling campaign put the tipping danger in writing on the machines themselves. The evidence we have does not show how much of the later drop it deserves credit for, so we won’t hand it any.
Now the fine print, because it matters here. That zero is a secondhand quote: we could not find a CPSC document that states it. Death certificates also have no ICD code for vending machines. (ICD codes are the standard labels doctors use for causes of death, such as W54 for being bitten or struck by a dog.) A death under a toppled machine would be filed under a broader label, so one since 2008 could have slipped past the tally. Zero reported is not the same as zero.
How often sharks kill people in the US
Very rarely, and not every year. Here is ISAF’s count of unprovoked fatal bites in US waters, meaning bites where the person did nothing to provoke the shark:
- 2012: 1
- 2013: 1
- 2014: 0
- 2015: 1
- 2016: 0
- 2017: 0
- 2018: 1
- 2019: 0
- 2020: 3
- 2021: 1
- 2022: 1
- 2023: 2
- 2024: 1
- 2025: 1
That is 13 deaths in 14 years. Four years (2014, 2016, 2017 and 2019) had none. The worst year was 2020, with 3.
Turn that into a personal chance. Across 2012-2025, 0.93 deaths a year among roughly 328 million Americans gives about 1 in 350 million a year. Using only 2016-2025, which averages exactly 1 a year, gives about 1 in 330 million. With counts this small, one bad summer moves the figure a lot, so treat the range as rough.
Most of those bites are not a shark hunting a person. ISAF sorts unprovoked bites mainly into mistaken-identity “hit and run” bites and investigation bites, where a shark tests something unfamiliar. Predation, a shark treating a person as food, is infrequent.
Was it ever really ‘twice as deadly’?
We could not check it. A fair test needs US shark deaths for the same 1978-1995 window as the vending machine count. We have not found an ISAF count for those years, so we cannot give you a sourced ratio for that era.
Even a clean ratio would be shaky. With only dozens of deaths behind each number, the gap between two small tallies can widen or shrink by chance from one window to the next. So we are retiring twice. The current ranking is sturdier: 13 shark deaths against zero reported vending machine deaths is not a gap chance easily explains, as long as that zero is real.
If you actually swim in the ocean
Every figure above divides deaths by the whole US population, including people who never go near the ocean. All of the shark risk falls on people in the water. If you surf every weekend, your personal chance is higher than the per-resident figure suggests.
The fair fix would be deaths per swim or per beach visit. We found no current count of US ocean swims to divide by. There is no count of vending machine users either, so a like-for-like comparison per exposure cannot be built from the evidence.
The closest per-visit figure we found covers a different danger. The United States Lifesaving Association puts the chance of drowning at a beach guarded by its affiliated lifeguards at 1 in 18 million per visit. That is drowning, not sharks, and only at guarded beaches, so it says nothing about your shark odds per swim. It does show the kind of number that would settle the question, if anyone published it for sharks.
Deadlier than both: dogs
View the data table
| Outcome | |
|---|---|
| Dogs (bitten or struck), 2011-2021 average | 43 |
| Sharks (unprovoked, US waters), 2012-2025 average | 0.9300 |
| Vending machines, since 2008 (none reported to CPSC) | 0 |
If you want a genuinely bigger animal risk, look at the one on the couch. The CDC’s National Center for Health Statistics counted 468 US deaths from being bitten or struck by a dog from 2011 to 2021. That is an average of 43 a year, or a chance of about 1 in 7.6 million a year for a US resident. The yearly count ranged from 31 in 2016 to 81 in 2021.
Side by side, dogs kill dozens of Americans a year, sharks about 1, and vending machines none that CPSC has reported since 2008. The windows differ (2011-2021 for dogs, 2012-2025 for sharks), but the gap is far too large for that to change the order.
The dog count has kept rising. DogsBite.org, an advocacy site, reports that CDC WONDER, the CDC’s online death database, recorded 127 dog-attack deaths in 2024. That would be roughly 1 in 2.7 million. We have not checked that figure in WONDER directly, so treat it as provisional.
Why sharks feel scarier than snack machines
Sharks are vivid and vending machines are boring. Two ideas explain much of the gap. The first is dread: people fear risks that feel uncontrollable and gruesome far more than ordinary ones, and being bitten by a large wild animal is about as dreadful as it gets. The second is availability: people judge how common something is by how easily an example comes to mind. A fatal shark bite makes national news. A toppled soda machine is a poor movie plot.
We did not find a study that measured fear of these two causes side by side, so read this as explanation, not evidence. The one practical lesson the record does support is small and specific. Every death in CPSC’s 1978-1995 count came from rocking or tilting a machine. If one keeps your dollar, let it keep it.