Who wins Boston: the odds by country
Kenya, most of the time. From 1988 through 2026, Boston held 38 men’s and 38 women’s open races. (There was no in-person race in 2020.) Kenyan runners won 45 of those 76 titles. That is about 59%, or 1 in 1.69.
“Open” means the main running divisions, not the wheelchair races. Split by division, the picture sharpens:
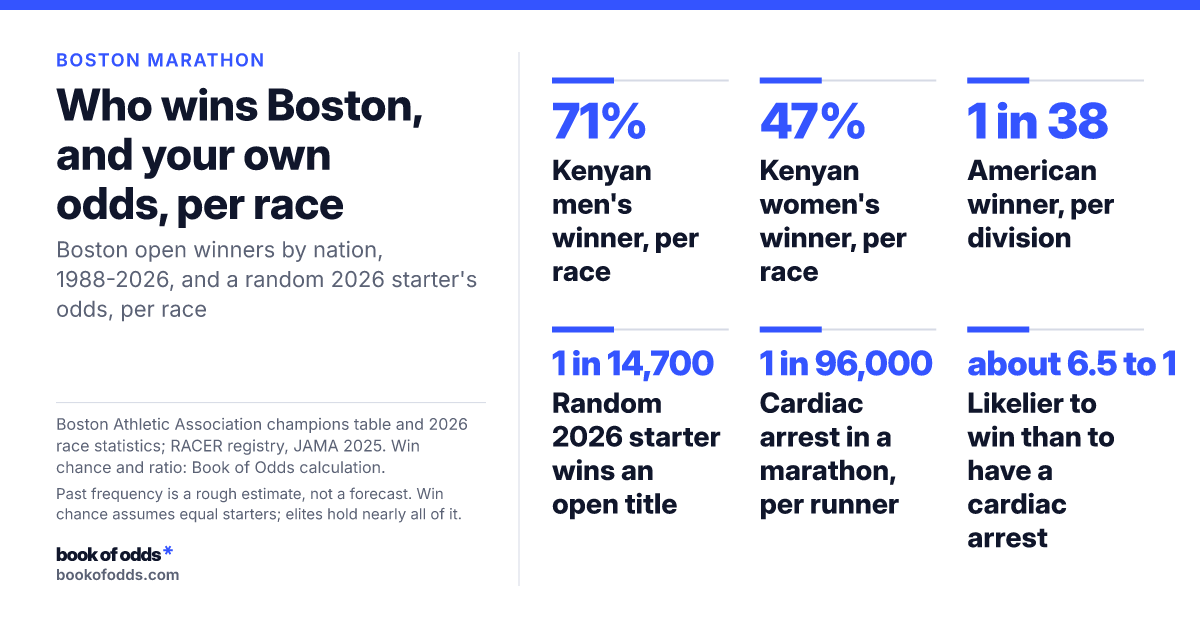
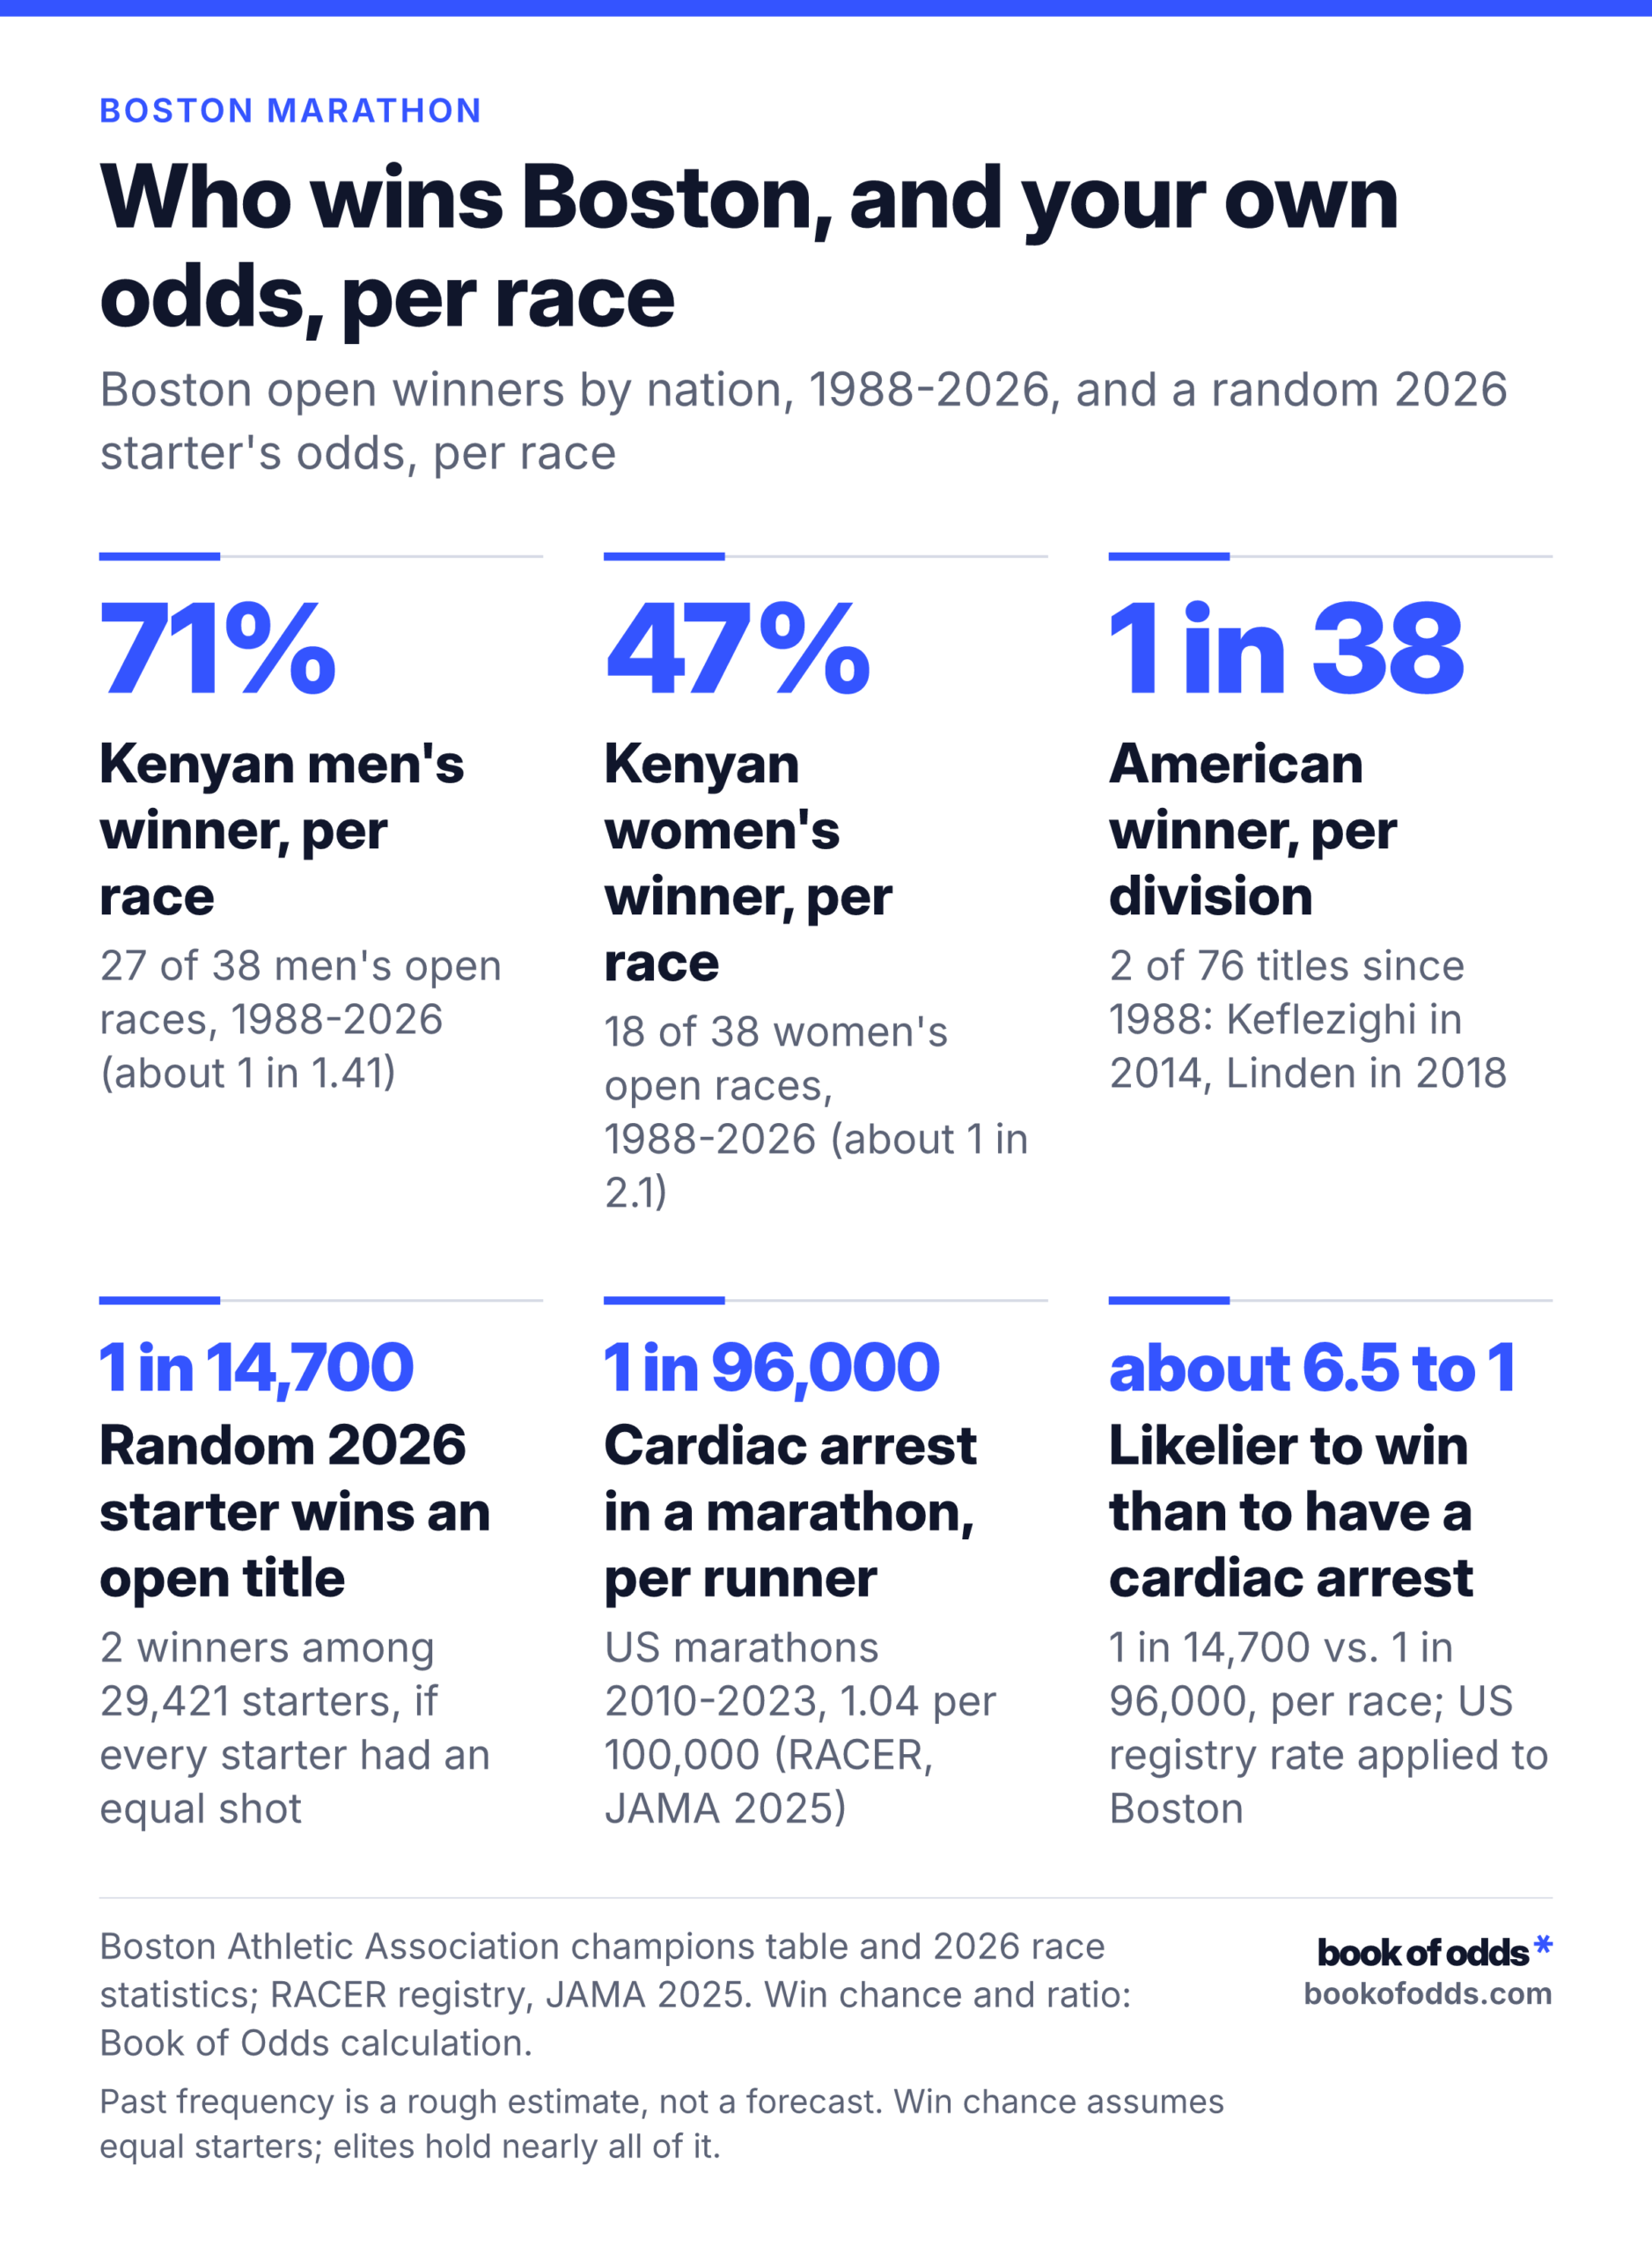
- Men: Kenya won 27 of 38 races (about 71%, or 1 in 1.41). Ethiopia won 7 (about 18%, or 1 in 5.4). Italy, South Korea, the US and Japan won one each.
- Women: Kenya won 18 of 38 (about 47%, or 1 in 2.1). Ethiopia won 8 (about 21%, or 1 in 4.75). Russia or the CIS won 4, Germany 3, Portugal 2, and Norway, Poland and the US 1 each.
The streak is current. Kenya swept both 2025 and 2026. John Korir won the 2026 men’s race in 2:01:52, a course record. Sharon Lokedi won the women’s race in 2:18:51, and her 2:17:22 from 2025 is still the women’s course record.
One caution before you bet the house. These are past frequencies, used as a rough per-race estimate. They tell you how often a country has won, not who wins next April. A single race depends on who starts and how the day goes.
Kenya vs. Ethiopia: no takeover
View the data table
| Outcome | |
|---|---|
| Kenya, men and women, 1988-2026 (45 of 76) | 59 |
| Kenya, men and women, last 20 races (26 of 40) | 65 |
| Ethiopia, men, 1988-2026 (7 of 38) | 18 |
| Ethiopia, women, 1988-2026 (8 of 38) | 21 |
| Ethiopia, men and women, last 20 races (10 of 40) | 25 |
| United States, men and women, 1988-2026 (2 of 76) | 2.6000 |
| United States, men and women, last 20 races (2 of 40) | 5 |
A few years ago, a popular storyline said Ethiopians were taking over Boston. The record doesn’t back it up.
Look only at the last 20 races (2006 to 2026, skipping 2020). Kenyans won 26 of 40 open titles, or 65%. Ethiopians won 10 of 40, or 25%. Kenya’s share went up compared with the full window, from 59% to 65%. That is the opposite of a takeover.
The split is identical in both divisions: 13 Kenyan wins and 5 Ethiopian wins among the men, and the same among the women.
Kenya’s run started early, too. Kenyan men won 17 of the 22 men’s races from 1988 to 2009. Ethiopia is a strong second, not a successor.
Why East Africa? People usually point to high-altitude training, a deep running culture and the sheer number of talented runners. We didn’t test those explanations here, and none of them decides any given race.
Men vs. women: different histories, same recent odds
Over the long window, the two divisions look different. Kenyan men won 71% of their races. Kenyan women won 47%. The gap is about timing. Before 1997, Europeans won most of the women’s titles, which is where the Russian, German, Portuguese, Norwegian and Polish wins come from.
Over the last 20 races, the gap disappears. Each division had 13 Kenyan winners, 5 Ethiopian winners and 1 American. So if you want odds by division across the whole period, use the long window: about 71% for a Kenyan man and 47% for a Kenyan woman. If you want the recent pattern, the two races now look the same.
The women’s division is younger than the race itself. Bobbi Gibb ran Boston without a number in 1966 and finished in 3:21:40. Kathrine Switzer entered as ‘K.V. Switzer’ and in 1967 became the first woman to finish with a bib number. The official women’s division began in 1972. You can find more Boston Marathon history and trivia on a separate page.
The American drought, and the two wins that broke it
View the data table
| Outcome | |
|---|---|
| 1975-1984 (7 of 10 races) | 70 |
| 1988-2026 (1 of 38 races) | 2.6000 |
| Last 20 races, 2006-2026 (1 of 20) | 5 |
Americans once owned this race. From 1975 to 1984, American men won 7 of 10 Boston men’s races, or 70%. Bill Rodgers took four of them: 1975, 1978, 1979 and 1980. His 1975 time of 2:09:55 beat Ron Hill’s 1970 course record of 2:10:30. Jack Fultz won in 1976, Alberto Salazar in 1982 and Greg Meyer in 1983.
Then the American wins stopped. Meb Keflezighi, the 2009 New York City Marathon champion, ended the men’s drought in 2014 with a 2:08:37. He was the first American man to win since Meyer in 1983. Desiree Linden did the same for the women in 2018, winning in 2:39:54. She was the first American woman to win since Lisa Larsen Weidenbach in 1985. No American man has won since 2014, through 2026.
So what are the odds an American wins? Since 1988, Americans won 2 of 76 titles, one in each division. That works out to 1 in 38 per division, or about 2.6% per race. Over the last 20 races it’s 1 in 20 per division (5%). The recent figure looks better only because both wins, in 2014 and 2018, fall inside the shorter window. Rare, then, but no longer zero.
We count nationality the way the Boston Athletic Association (B.A.A.) lists it. The B.A.A. lists Keflezighi, who was born in Eritrea, as American.
Your chance of winning versus your chance of a cardiac event
View the data table
| Outcome | |
|---|---|
| Random 2026 Boston starter wins an open title (modeled) | 14,700 |
| Cardiac arrest, US marathons 2010-2023 | 96,000 |
| Cardiac arrest death, US marathons 2000-2010 | 159,000 |
| Cardiac arrest death, US marathons and halves 2010-2023 | 500,000 |
Say you’re one of the 29,421 official starters in 2026. That field had 16,515 men, 12,800 women and 106 non-binary runners. Two open titles were up for grabs. If every starter had an equal shot, your chance would be 2 in 29,421, or about 1 in 14,700. By division, it’s 1 in 16,515 for a man and 1 in 12,800 for a woman.
That equal-shot assumption is deliberately naive. In reality, nearly all the winning chance sits with a small invited elite field. For everyone else, it rounds to zero. Treat 1 in 14,700 as a modeled yardstick, not your personal odds.
Now the risk side. A US registry of cardiac arrests at races, called RACER, reported in JAMA in 2025. In US marathons from 2010 to 2023, there were 1.04 cardiac arrests per 100,000 participants. Divide 100,000 by 1.04 and you get about 1 in 96,000 per race. A cardiac arrest means the heart suddenly stops pumping. It is not the same as dying, and the death numbers are smaller.
In marathons and half-marathons combined, from 2010 to 2023, cardiac arrest deaths ran at 0.20 per 100,000, or 1 in 500,000. That is down from 0.39 per 100,000 in 2000-2009, so the death rate roughly halved. The 2025 update didn’t give a marathon-only death rate. The earlier RACER study, in the New England Journal of Medicine in 2012, did: 0.63 deaths per 100,000 marathon runners from 2000 to 2010, about 1 in 159,000.
Side by side, per race, a random starter was:
- About 6.5 times likelier to win than to have a cardiac arrest (1 in 14,700 vs. 1 in 96,000, RACER 2010 to 2023).
- About 11 times likelier to win than to die of cardiac arrest, using the older marathon-only rate (about 1 in 159,000, NEJM 2000 to 2010).
- About 34 times likelier to win than to die of cardiac arrest, using the newer combined marathon and half-marathon rate (1 in 500,000).
What this doesn’t show: these are US-wide rates applied to Boston, and Boston’s own risk wasn’t measured. Risk differs by age and sex, and men’s risk is higher. The win side uses the naive equal-chance model. The fair takeaway is that both chances are small, and a fatal cardiac arrest is the smaller one.
From barefoot Bikila to super shoes
SHOES
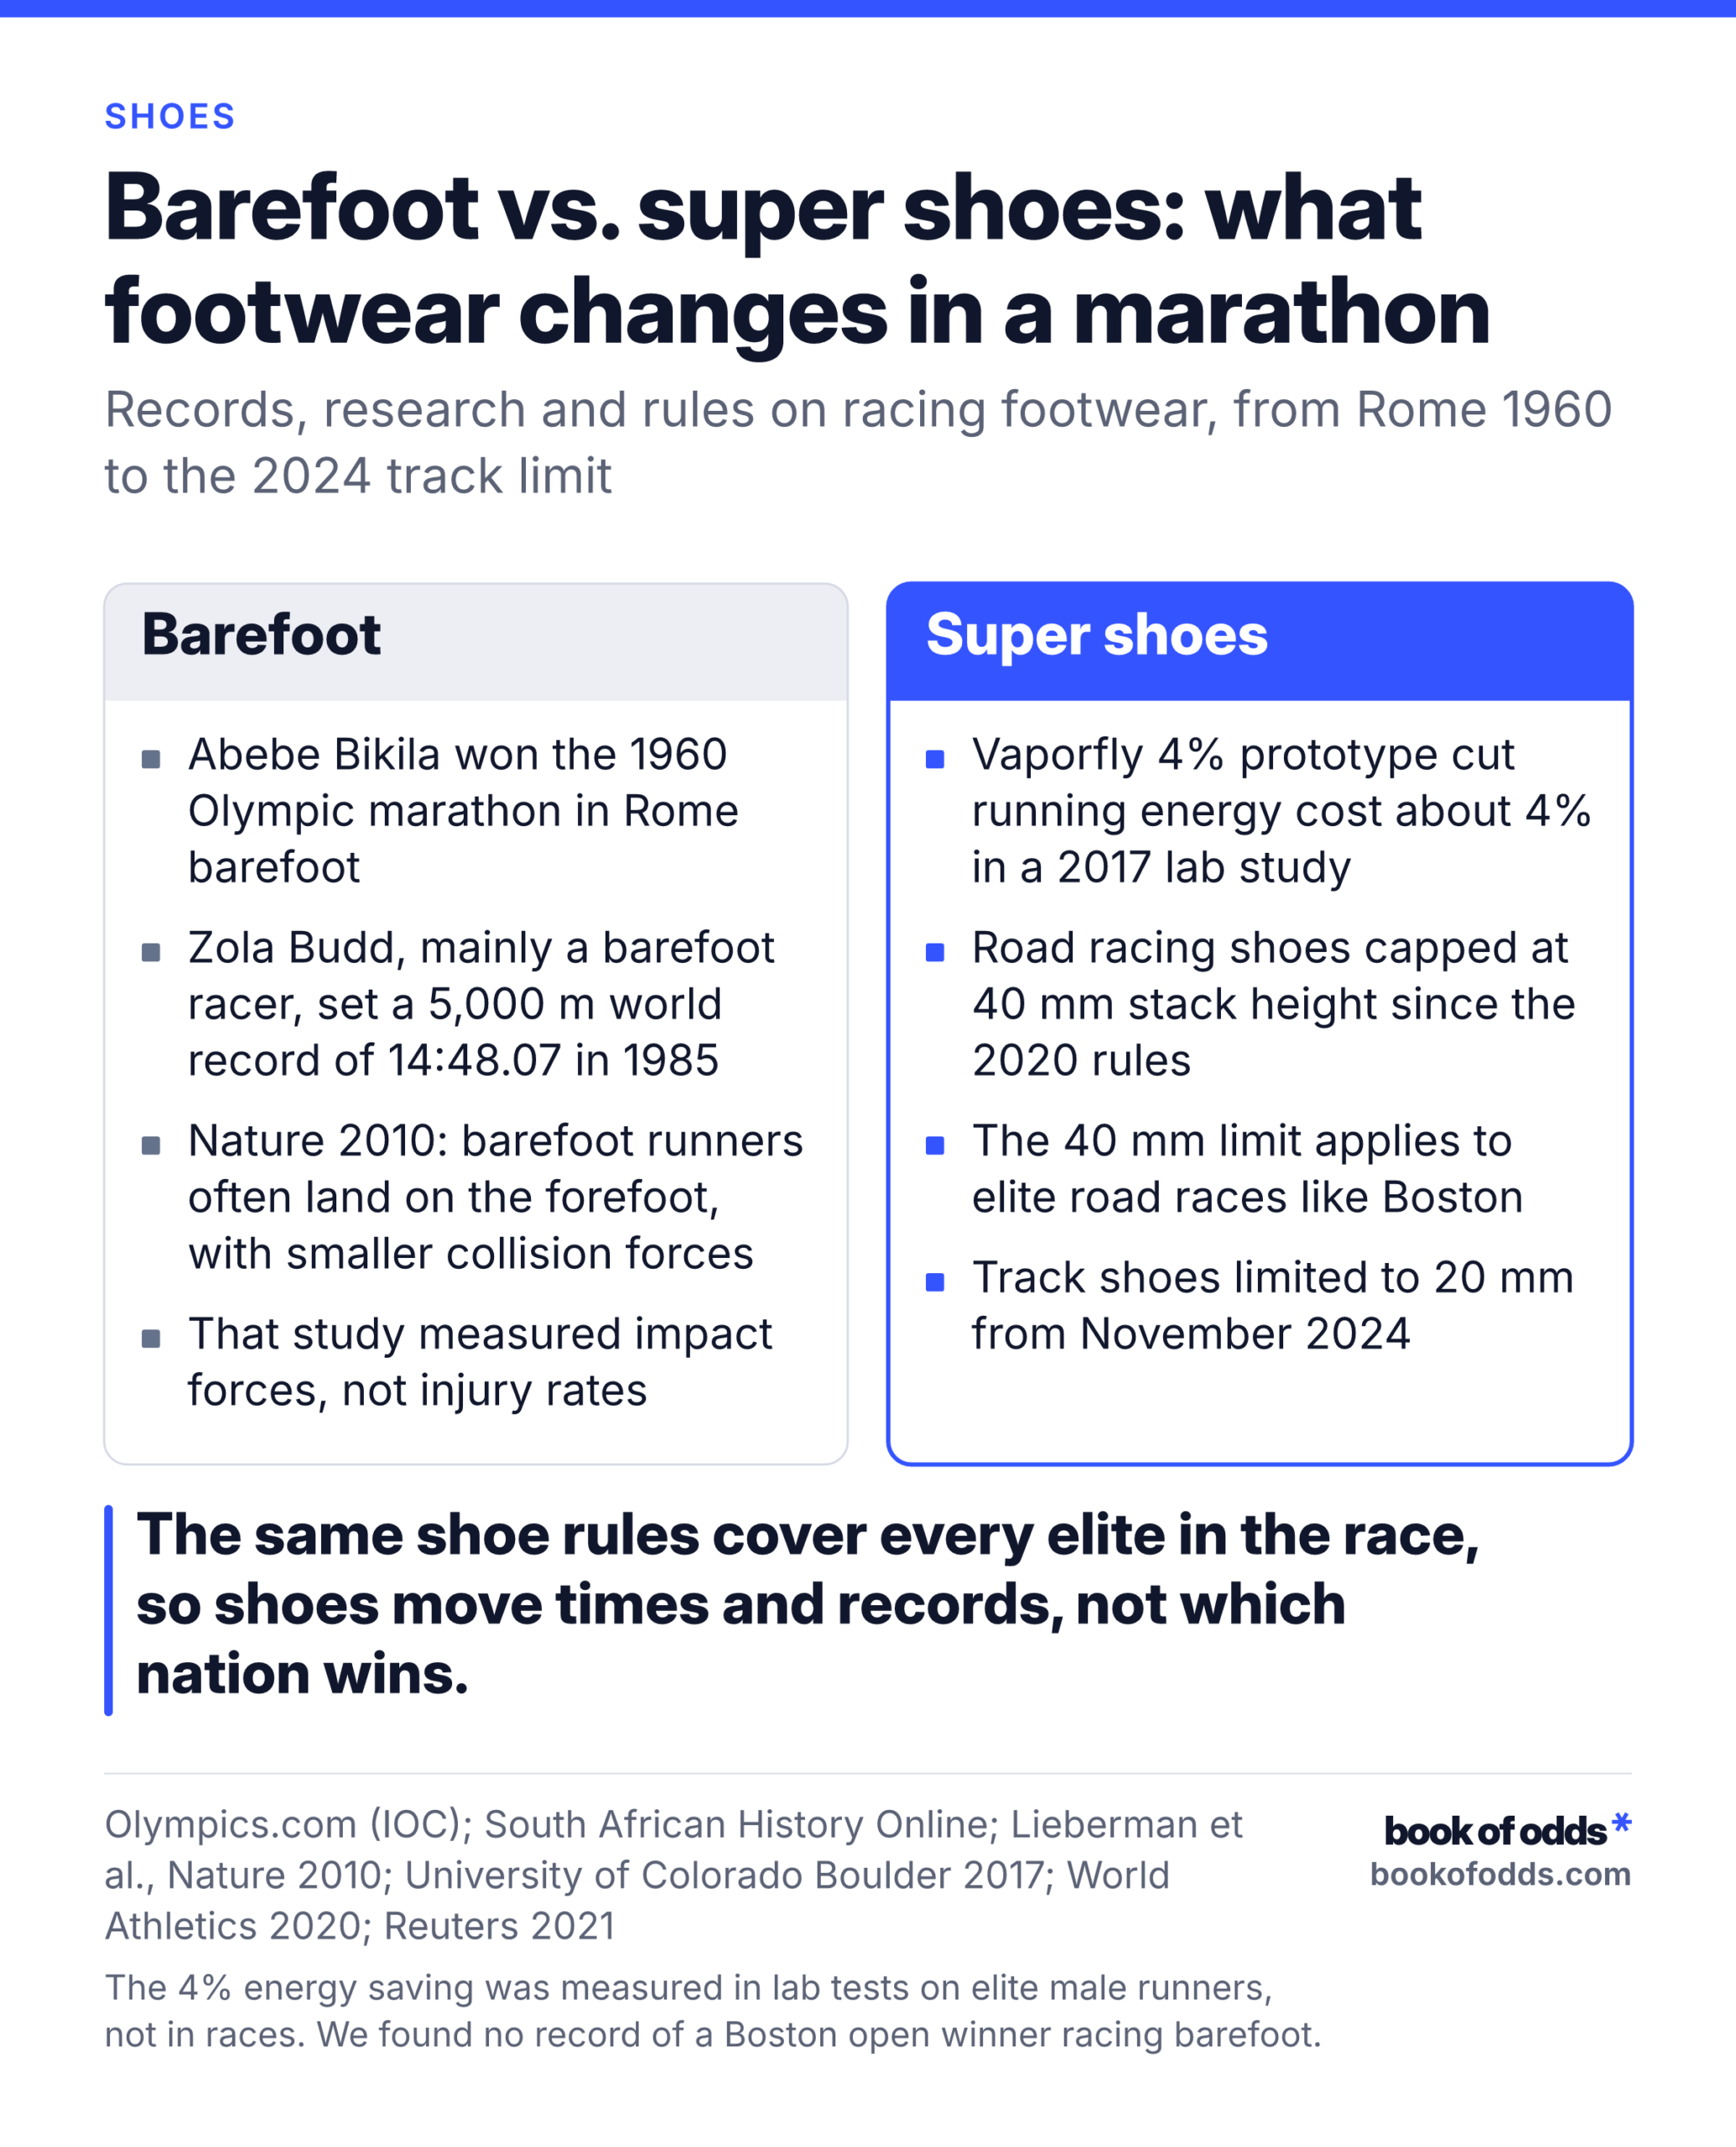
Barefoot vs. super shoes: what footwear changes in a marathon
Records, research and rules on racing footwear, from Rome 1960 to the 2024 track limit
Barefoot
- Abebe Bikila won the 1960 Olympic marathon in Rome barefoot
- Zola Budd, mainly a barefoot racer, set a 5,000 m world record of 14:48.07 in 1985
- Nature 2010: barefoot runners often land on the forefoot, with smaller collision forces
- That study measured impact forces, not injury rates
Super shoes
- Vaporfly 4% prototype cut running energy cost about 4% in a 2017 lab study
- Road racing shoes capped at 40 mm stack height since the 2020 rules
- The 40 mm limit applies to elite road races like Boston
- Track shoes limited to 20 mm from November 2024
The same shoe rules cover every elite in the race, so shoes move times and records, not which nation wins.
Olympics.com (IOC); South African History Online; Lieberman et al., Nature 2010; University of Colorado Boulder 2017; World Athletics 2020; Reuters 2021
The 4% energy saving was measured in lab tests on elite male runners, not in races. We found no record of a Boston open winner racing barefoot.
Book of Odds bookofodds.com
Download image of Barefoot vs. super shoes: what footwear changes in a marathon
The most famous barefoot marathon win wasn’t at Boston. Abebe Bikila of Ethiopia won the 1960 Olympic marathon in Rome barefoot, becoming the first black African to win Olympic marathon gold. His own shoes had worn out, and the replacements gave him blisters, so he ran without.
Zola Budd, who mainly trained and raced barefoot, set the women’s 5,000 m world record in 1985. Her time, 14:48.07, was about ten seconds under the previous best.
Barefoot runners do turn up at Boston. ‘Barefoot Rick’ Roeber ran 21 of Boston’s 26 miles barefoot, carrying sandals, and later ran marathons fully barefoot. A later profile puts that Boston run in 2004, but the accounts disagree on details, so hold the year loosely.
The science of barefoot running is narrower than its fans suggest. A 2010 Harvard study in Nature found that habitually barefoot runners often land on the forefoot, while runners in shoes mostly land heel first. Forefoot landing produced smaller collision forces, which may protect against some impact injuries. The study measured forces, not injury rates.
Then came super shoes. A 2017 University of Colorado Boulder study found that the Nike Vaporfly 4% prototype cut the energy cost of running by about 4% on average, compared with other marathon racing shoes. Those were lab tests on elite male runners. World Athletics responded with limits. Since its 2020 rule changes, road racing shoes can be no more than 40 mm thick, and that applies at elite road races like Boston. In December 2021 it announced a single 20 mm limit for track shoes from November 1, 2024, and left the 40 mm road limit unchanged.
So do shoes matter? For times, plausibly yes. A 4% drop in energy cost is a lot at the front of a marathon, and Korir’s 2:01:52 came in the super-shoe era. For which country wins, the record says no. Kenyan men won 17 of 22 Boston races from 1988 to 2009, before that 2017 study, and Kenya still leads both windows now. The same shoe rules cover every elite runner in the race, so shoes raise the ceiling on times rather than pick the nation. That last point is our reading of the record, not a measured result.
And a barefoot Boston winner? We found no record of a Boston open winner racing barefoot. That is an absence of evidence, not a confirmed check of every winner’s feet.
What the 2010 version got wrong
- The American men’s drought. It was real in 2010, but Meb Keflezighi ended it in 2014. No American man has won since, through 2026.
- American and Kenyan odds. Since 1988, Americans won 1 in 38 races per division (1 in 20 over the last 20 races). Kenyans won 45 of 76 titles, about 1 in 1.69, and 26 of 40, or 1 in 1.54, over the last 20 races.
- Winning versus dying. The earlier comparison set a per-race chance of winning against a yearly death rate for the whole population. Those don’t share a denominator. Per race, a random starter is about 6.5 times likelier to win than to have a cardiac arrest, and about 11 to 34 times likelier to win than to die of one, depending on which death rate you use.
- Course-record context. Robert Kipkoech Cheruiyot, a four-time Boston champion, withdrew from the 2010 race with an injured right hip. His 2006 time of 2:07:14 was the course record until Robert Kiprono Cheruiyot ran 2:05:52 in 2010. Two different runners, very similar names.
- Dropped details. Hundreds of runners did miss the 2010 race because of the volcanic ash over Europe, but we couldn’t confirm the larger estimate or one named runner’s withdrawal. Catherine Ndereba was listed as withdrawn from the 2010 field, with no reason given. The claim about who supplied Bikila’s shoes is also unconfirmed. Those details are out.
How we calculated these odds
We counted open winners by the nation the B.A.A. lists in its official champions table, for 1988 through 2026. That is 38 races per division, because there was no in-person race in 2020; the October 2021 race is included. One women’s win is listed under the CIS, and we count it with Russia. Each share is wins divided by races, used as a rough per-race probability. The last 20 races (2006-2026) serve as a check on whether the pattern has shifted.
Your chance of winning divides the 2 open titles by the B.A.A.’s count of 29,421 official 2026 starters. The non-binary winner isn’t counted. Cardiac rates come from the RACER registry: JAMA in 2025 for 2010-2023 and the New England Journal of Medicine in 2012 for 2000-2010. Past frequency is not a forecast, and a registry average is not your personal risk.